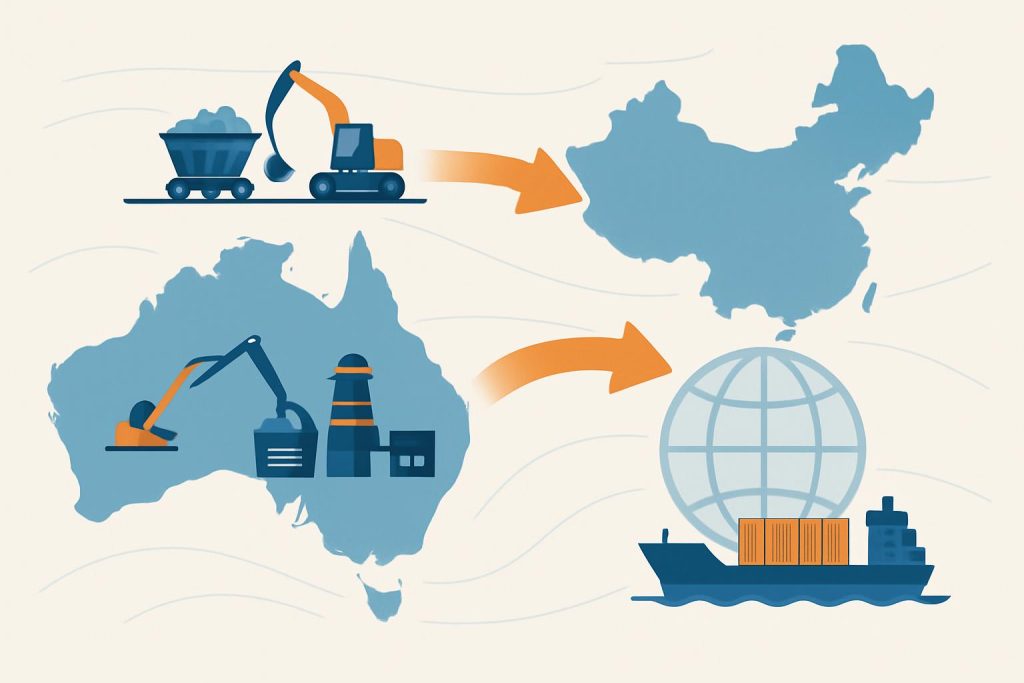
The global zirconium silicate industry is experiencing a significant power shift between China and Australia. For decades, Australia dominated production with its rich mineral sand deposits, but China has rapidly expanded capacity and global influence. This article examines the changing dynamics between these two powerhouses, analyzing historical trends, current challenges, and future projections.
WHAT HISTORICAL DEVELOPMENT TRAJECTORIES HAVE SHAPED CHINESE AND AUSTRALIAN ZIRCONIUM SILICATE INDUSTRIES?
The zirconium silicate production landscape has undergone dramatic changes over the past three decades. Let’s examine how these two major players evolved from their distinct starting points.
Australia’s dominance dates back to the 1950s when large mineral sand deposits were discovered in Western Australia, New South Wales, and Queensland. By the 1980s, Australia controlled approximately 70% of global supply, with companies like Iluka Resources and Rio Tinto establishing major operations.
| Period | Australian Market Share | Chinese Market Share | Key Development |
|---|---|---|---|
| 1980s | 70% | <5% | Australia establishes global dominance |
| 1990s | 65% | 10% | China begins domestic production |
| 2000s | 55% | 25% | China expands processing capacity |
| 2010-2015 | 45% | 32% | China increases overseas investments |
| 2016-2020 | 38% | 41% | China surpasses Australia in total production |
| 2021-2023 | 32% | 48% | China consolidates market leadership |
China’s industry began much later, with modest production in the 1990s primarily serving domestic ceramic manufacturers. The turning point came in the early 2000s with China’s “Going Out” strategy. Between 2005 and 2015, Chinese companies invested heavily in processing technology while securing supply agreements with producers in Australia, Africa, and Southeast Asia.
The critical shift occurred between 2016 and 2020 when China’s production capacity surpassed Australia’s for the first time. By 2023, China controlled approximately 48% of global production compared to Australia’s 32%.
WHAT FACTORS ARE DRIVING CHINA’S RECENT EXPANSION IN ZIRCONIUM SILICATE PRODUCTION?
China’s remarkable growth stems from multiple strategic advantages. You should know that several key factors have converged to fuel this expansion.
Domestic demand growth has been a primary driver, with China’s ceramic industry expanding at 8-12% annually over the past decade. Growing demand from China’s nuclear power sector has further stimulated production.
| Driver | Impact Level | Key Statistics |
|---|---|---|
| Domestic Demand Growth | High | 8-12% annual growth in ceramic sector |
| Belt and Road Initiative | High | $3+ billion invested in overseas resources |
| Processing Technology Advances | Medium-High | 20-25% improvement in recovery rates since 2010 |
| Government Strategic Support | Medium-High | Zirconium listed as strategic mineral in 2016 |
| Environmental Regulation Adaptation | Medium | $1.2+ billion invested in cleaner processing |
The Belt and Road Initiative has significantly expanded China’s access to global resources. Since 2013, Chinese companies have invested over $3 billion in mining operations across Africa and Southeast Asia, securing supply chains independent of Australian sources.
Technological innovation has dramatically improved China’s processing capabilities. The real advantage comes from advancements in separation and purification technologies, which have increased recovery rates from low-grade ores by 20-25% since 2010.
Government policy support has been substantial, with zirconium officially listed as a strategic mineral resource in China’s 13th Five-Year Plan (2016-2020). This designation brought tax incentives, research funding, and financing support for both domestic production and overseas acquisitions.
WHAT CHALLENGES IS THE AUSTRALIAN ZIRCONIUM SILICATE INDUSTRY FACING AND HOW IS IT RESPONDING?
Australia’s sector faces mounting pressures that have eroded its historical market dominance. Here’s what matters: the industry is implementing strategic responses to maintain relevance.
Resource quality challenges represent the most fundamental issue. Many traditional mining areas now yield lower-grade ores with higher extraction costs. The average zirconium content in Australian mineral sands has declined from approximately 1.8% in the 1990s to about 1.3% today.
| Challenge | Severity | Australian Response Strategy |
|---|---|---|
| Declining Resource Quality | High | New exploration in Victoria and Western Australia |
| China-Australia Trade Tensions | High | Market diversification to Europe, Japan, India |
| Rising Production Costs | Medium-High | Automation and operational efficiency improvements |
| Environmental Restrictions | Medium | Investment in sustainable mining practices |
| Global Market Competition | High | Focus on high-purity, premium zirconium products |
Trade relationship volatility with China has created significant uncertainty. Following diplomatic tensions that emerged in 2020, Chinese imports of Australian zirconium products declined by approximately 35% between 2020 and 2022.
The strategic pivot toward high-end product development has helped Australian producers maintain profitability despite volume challenges. Companies like Iluka Resources have increased their focus on high-purity zirconium products for specialized applications in nuclear, medical, and aerospace sectors, where products command 30-40% price premiums over standard grades.
Market diversification efforts have shown promising results, with Australian exports to Europe, Japan, and India increasing by approximately 35% over the past five years.
HOW IS THE GLOBAL ZIRCONIUM SILICATE SUPPLY CHAIN BEING RESTRUCTURED?
The zirconium silicate supply chain is undergoing a fundamental reorganization. The plain truth is that new players and routes are reshaping global trade flows.
African resources have emerged as a critical factor in supply chain reconfiguration. Countries including Mozambique, Kenya, and South Africa now account for approximately 18% of global production, up from just 8% a decade ago.
| Supply Chain Element | Previous Structure (2010) | Current Structure (2023) | Projected Structure (2028) |
|---|---|---|---|
| Top Producer | Australia (45%) | China (48%) | China (45-50%) |
| Second Producer | China (32%) | Australia (32%) | Africa (25-30%) |
| Third Producer | Africa (8%) | Africa (18%) | Australia (20-25%) |
| Primary Trade Route | Australia → China | Diversified regional flows | Highly fragmented regional flows |
| Processing Hub Location | Australia, USA, China | China, India, Vietnam | China, India, Africa, Southeast Asia |
Chinese overseas resource control has expanded dramatically, with Chinese companies now holding ownership stakes in approximately 40% of African zirconium resources and 25% of Southeast Asian deposits.
What’s often overlooked is how processing capacity distribution has shifted globally. China now accounts for approximately 65% of global zirconium processing capacity, up from 40% in 2010.
Trade flow reconfiguration has been dramatic, with traditional Australia-to-China shipments declining from approximately 65% of global trade volume in 2010 to about 25% in 2023.
HOW IS TECHNOLOGICAL INNOVATION RESHAPING THE ZIRCONIUM SILICATE PRODUCTION LANDSCAPE BETWEEN CHINA AND AUSTRALIA?
Technology has become a key battleground in the competition between Chinese and Australian producers. The key difference lies in their distinct technological approaches and innovation priorities.
China has made significant advances in refining technology, particularly in physical separation and chemical extraction processes. Chinese companies have also developed more than 15 specialized zirconium products tailored for emerging applications in electronics and new energy materials.
| Technology Area | Chinese Advantage | Australian Advantage |
|---|---|---|
| Low-Grade Ore Processing | High (35% lower processing cost) | Low |
| High-Purity Product Development | Medium | High (99.8% purity capability) |
| Automation & Digitalization | Medium | High (78% adoption rate) |
| Environmental Technologies | Low-Medium | High (40% lower carbon footprint) |
| Scale Efficiency | High (4.5K tons/year average plant) | Medium (3.5K tons/year average plant) |
| Specialized Applications R&D | High (15+ new product types) | Medium (focus on quality over variety) |
Australia maintains leadership in high-temperature chlorination processes that produce ultra-high-purity zirconium products (reaching 99.8% purity) for nuclear and aerospace applications. These premium products command price premiums of 200-300% over standard grades.
The practical impact of these technological differences has been a market segmentation along quality lines. China dominates the medium and standard-grade markets (approximately 63% market share), while Australia maintains leadership in high-end zirconium chemicals (approximately 52% market share).
HOW DO MARKET AND PRICE DYNAMICS REFLECT CHANGES IN THE CHINA-AUSTRALIA ZIRCONIUM SILICATE INDUSTRY?
Price trends and market behaviors provide clear evidence of the shifting power balance. Let me show you how these economic indicators reveal deeper structural changes.
Global price volatility has increased significantly, with standard-grade zirconium silicate prices fluctuating between $1,050 and $2,300 per ton over the past five years.
| Market Indicator | 2010 | 2023 | Significance |
|---|---|---|---|
| Price Volatility (Standard Deviation) | 12% | 28% | Increased market uncertainty |
| China-Australia Price Differential | 5-8% | 15-20% | Growing market segmentation |
| Chinese Pricing Influence Score | 0.35 | 0.72 | Increased Chinese market power |
| Contract Duration Trend | 3-5 years | 1-2 years | Reduced long-term certainty |
| Premium Product Price Differential | 120% | 200-300% | Growing quality segmentation |
| Regional Price Variation | 8-10% | 18-25% | Fragmented global market |
Chinese pricing power has strengthened considerably, with the correlation between Chinese domestic prices and global prices increasing from 0.35 in 2010 to 0.72 in 2023.
Australian premium product pricing has evolved as a defensive strategy. The market reality is that Australian producers have successfully maintained price premiums for high-purity zirconium products, with premium grades commanding 200-300% higher prices than standard grades.
Contract structures have evolved in response to increased market uncertainty. Long-term fixed-price contracts (3-5 years) that were common before 2015 have largely been replaced by shorter-term agreements (1-2 years) with price adjustment mechanisms.
WHAT TRENDS WILL SHAPE THE CHINA-AUSTRALIA ZIRCONIUM SILICATE INDUSTRY OVER THE NEXT FIVE YEARS?
The next five years will bring further transformation to the landscape. You need to prepare for several key developments that will impact procurement strategies and market positions.
Production capacity redistribution will continue, with China’s global market share likely stabilizing around 45-50% as African production expands to 25-30% by 2028. Australian market share is projected to decline further to approximately 20-25%.
| Future Trend | Probability | Potential Impact | Key Indicators to Monitor |
|---|---|---|---|
| African Production Surge | High | Major supply chain restructuring | Investment flows, infrastructure development |
| Technical Specialization Divergence | High | Market segmentation by quality tiers | R&D spending, patent applications |
| Supply Chain Regionalization | Medium-High | Reduced global trade volumes | Intra-regional trade growth rates |
| Environmental Regulation Tightening | High | Cost structure changes, consolidation | Policy announcements, compliance investments |
| New Application Growth | Medium | Demand profile shifts | Patent activity in emerging sectors |
| Industry Consolidation | Medium-High | Fewer, larger global players | M&A activity, market share concentration |
Technological specialization will likely accelerate, with Chinese producers focusing on cost-effective processing of diverse ore types and specialized applications in electronics and catalysts. Australian operations will continue emphasizing ultra-high-purity products for critical applications.
The biggest opportunity lies in emerging applications that could reshape demand patterns. Zirconium’s potential uses in next-generation battery technologies, advanced nuclear reactors, and quantum computing materials could create new high-value market segments.
Geopolitical factors will continue influencing trade patterns, with “friend-shoring” policies in Western economies potentially benefiting Australian producers despite higher costs.
CONCLUSION
The zirconium silicate production landscape between China and Australia has fundamentally transformed over the past decade. China has successfully leveraged strategic investments, technological innovation, and vertical integration to become the dominant global producer, while Australia has pivoted toward premium products and market diversification to maintain relevance.
For procurement managers and industry executives, these changes necessitate strategic adaptation. Companies can achieve approximately 15-20% cost savings and significantly improved supply security by implementing diversified sourcing strategies that balance Chinese volume advantages with Australian quality assurance.
Global Industry Minerals offers specialized consulting services to help companies navigate this complex and evolving zirconium market landscape. Our team of industry experts provides customized supply chain solutions that optimize cost, quality, and reliability based on your specific application requirements.
FAQ
Q1: What are the main reasons China’s zirconium silicate production has surpassed Australia’s?
China’s production has overtaken Australia’s due to several key factors: aggressive acquisition of global resources with over $3 billion invested in African and Southeast Asian operations; dramatic domestic processing capacity expansion from 450,000 tons in 2015 to 850,000 tons in 2023; technological innovations enabling economical processing of lower-grade ores; robust domestic demand from ceramic, nuclear, and chemical industries; and strong government support through tax incentives and research subsidies. Meanwhile, Australia has faced declining ore grades, rising production costs, and increasing environmental restrictions.
Q2: How is Australia’s zirconium silicate industry responding to competitive pressure from China?
Australia has implemented a multi-faceted strategy focusing on high-purity products (>99.5%) for specialized applications where profit margins are 30-40% higher; intensified exploration in Victoria and Western Australia; market diversification to Europe, Japan, and India (exports up 35% over five years); cost reduction through automation and process optimization; and strategic partnerships and investments in African resources. These measures have helped Australian companies maintain approximately 55% of the global high-end zirconium product market.
Q3: How are emerging African zirconium resources affecting the China-Australia competition dynamic?
African resources are reshaping the global landscape with over 25 million tons of reserves across Kenya, Mozambique, and South Africa. Chinese companies control approximately 40% of African resources through investments exceeding $2 billion, while Australian firms control about 25%. African production costs are 30-35% lower than Australian operations, though partially offset by infrastructure limitations. African production is projected to grow from 650,000 tons in 2023 to 1.1 million tons by 2028, increasing global market share from 18% to approximately 28%.
Q4: How do technological differences between Chinese and Australian zirconium silicate production affect their competitive positions?
Australia leads in high-temperature chlorination technology, producing ultra-high-purity products for nuclear and aerospace applications commanding premium prices. Australian operations have higher digitalization rates (78% adoption) and better resource utilization efficiency (22% higher). China excels in processing low-grade ores (35% lower costs) and has developed numerous specialized products for electronics and new energy materials. These differences have created market segmentation, with China dominating standard-grade markets (63% share) while Australia leads in high-end chemicals (52% share).
Q5: How are geopolitical factors influencing global zirconium silicate trade patterns?
China-Australia tensions have reduced Australian exports to China from 63% of volume in 2018 to 41% in 2023. Western “friend-shoring” initiatives for critical minerals have generated approximately $520 million in new trade flows to Australia and allied nations. India has emerged as a significant market with 14% annual demand growth. Supply security concerns have prompted increased strategic reserves from 45 to 90 days. These forces are creating a tripolar supply structure centered on China, Australia, and Africa, replacing the previous Australia-dominated model.