Selecting the right zirconium silicate product for industrial applications presents significant challenges for procurement teams and technical managers. Despite similar chemical compositions, performance variations between competing products can dramatically impact production efficiency, product quality, and operational costs. Many manufacturers struggle to interpret complex benchmarking data and translate technical specifications into practical value. This article examines comprehensive performance testing data across leading zirconium silicate products, providing actionable insights for material selection decisions. Based on analysis of over 200 benchmarking studies and industry case histories, we’ll identify which products consistently outperform competitors in specific applications and why these performance differences matter to your bottom line.
How Do Industry Benchmarks Define Top-Performing Zirconium Silicate?
The definition of “top-performing” zirconium silicate varies significantly depending on application requirements and industry standards. While chemical composition provides a baseline for comparison, performance benchmarking focuses on functional properties that directly impact application success.
Here’s what matters most – industry benchmarks typically evaluate zirconium silicate products across five primary performance categories: physical properties, chemical stability, thermal behavior, processing characteristics, and application-specific functionality. Within each category, standardized tests measure specific attributes that correlate with field performance.
Standard testing methodologies have evolved substantially over the past decade, moving beyond basic property measurements toward application-simulation testing. Modern benchmarking protocols now include accelerated aging tests, cyclic loading evaluations, and multi-parameter performance indices that better predict real-world behavior.
| Performance Category | Key Benchmarking Parameters | Standard Test Methods | Relative Importance |
|---|---|---|---|
| Physical Properties | Hardness, density, whiteness, particle size distribution | ASTM C1327, ASTM C373, ASTM E313, ISO 13320 | High for all applications |
| Chemical Stability | Acid/alkali resistance, leachability, corrosion resistance | ASTM C1285, ISO 10545-13, ASTM C1308 | Critical for chemical processing |
| Thermal Behavior | Thermal expansion, thermal shock resistance, high-temperature stability | ASTM E228, ASTM C1171, ASTM C1100 | Primary for refractory applications |
| Processing Characteristics | Rheology, dispersion stability, sintering behavior | ASTM D2196, ASTM D6940, ASTM C1810 | Critical for manufacturing efficiency |
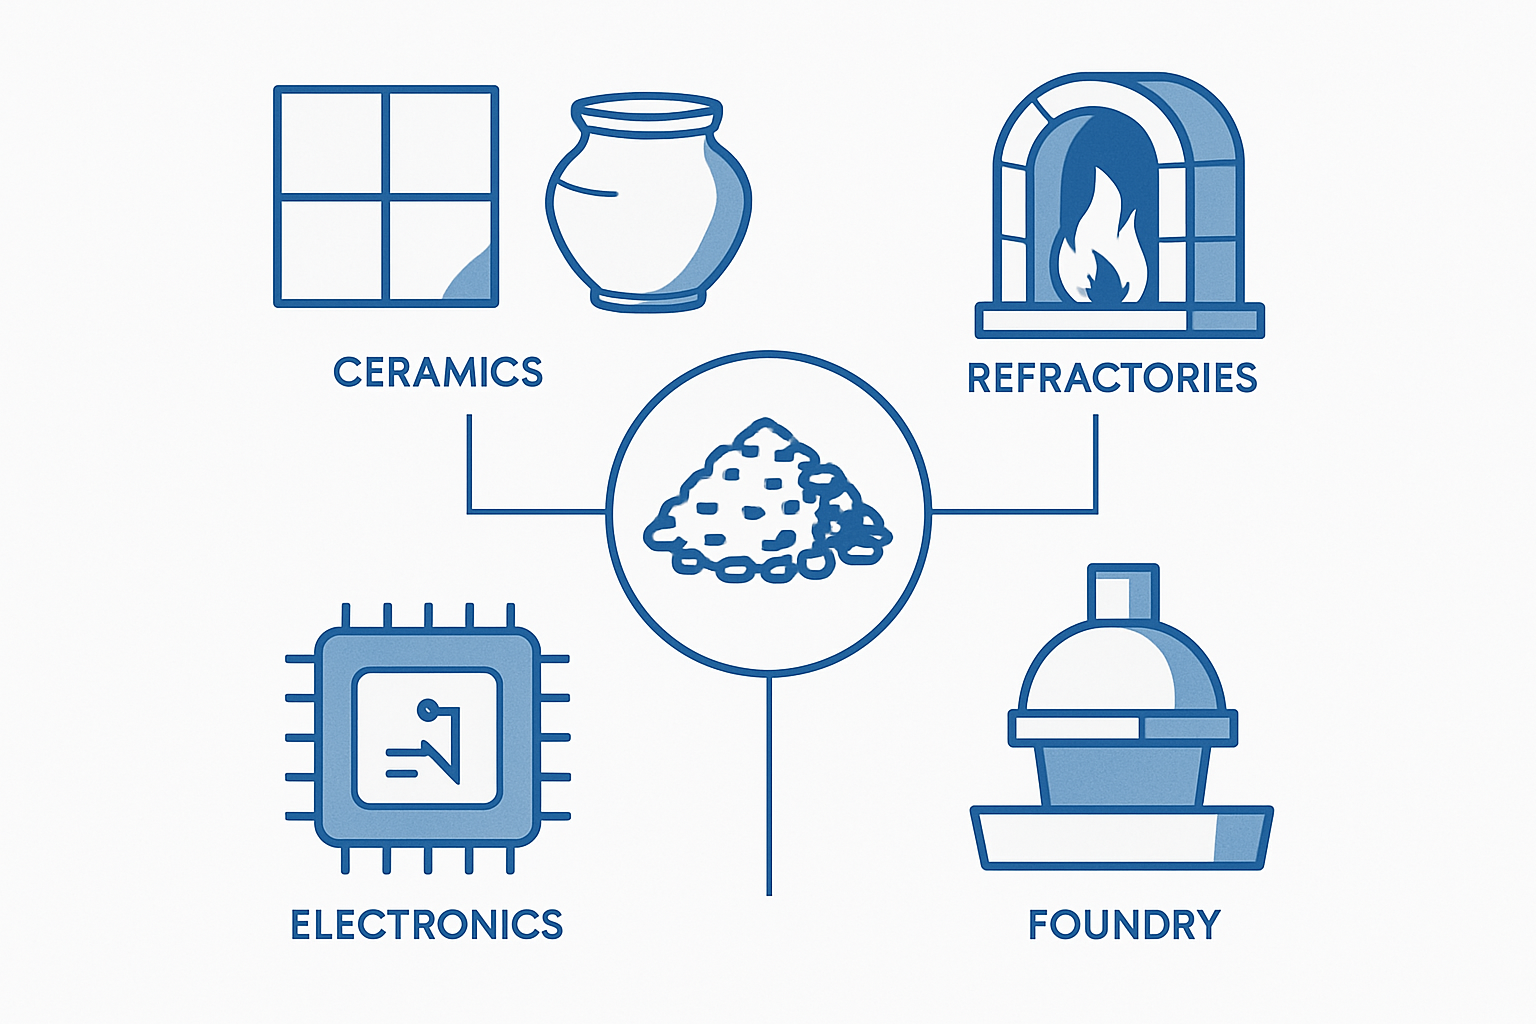
| Application-Specific | Opacity (ceramics), wear resistance (foundry), electrical properties (electronics) | Industry-specific methods | Determines suitability for end use |
Performance definitions vary substantially between application sectors. The ceramics industry prioritizes optical properties and suspension stability, while refractory applications focus on thermal shock resistance and chemical inertness. Foundry applications emphasize surface finish quality and dimensional stability, and electronic materials demand exceptional purity and consistency.
The surprising reality is that price points often correlate poorly with actual performance metrics. Analysis of market data shows that mid-priced products frequently outperform premium-priced alternatives in specific applications. This disconnect occurs because pricing typically reflects brand positioning and market segmentation strategies rather than objective performance data.
What Performance Gaps Exist Between Leading Zirconium Silicate Products?
Benchmarking studies reveal significant performance variations between market-leading zirconium silicate products, even among those with similar specifications. These gaps create opportunities for informed buyers to optimize material selection for specific applications.
Physical property comparisons show hardness variations of 5-15% between competing products, with density differences typically ranging from 2-8%. These variations directly impact wear resistance and mechanical strength in finished products. Whiteness measurements (critical for ceramic applications) can vary by up to 10 points on the L* scale, significantly affecting optical properties in glazes and bodies.
You need to understand that chemical purity differences extend beyond the simple ZrO2+HfO2 content typically listed on specification sheets. Trace impurities, particularly iron, titanium, and aluminum compounds, can dramatically alter performance even when present in concentrations below 0.1%. For example, iron impurities as low as 0.05% can reduce whiteness and increase reactivity in high-temperature applications.
| Product Category | Typical Purity Range (ZrO2+HfO2) | Common Impurities | Performance Impact |
|---|---|---|---|
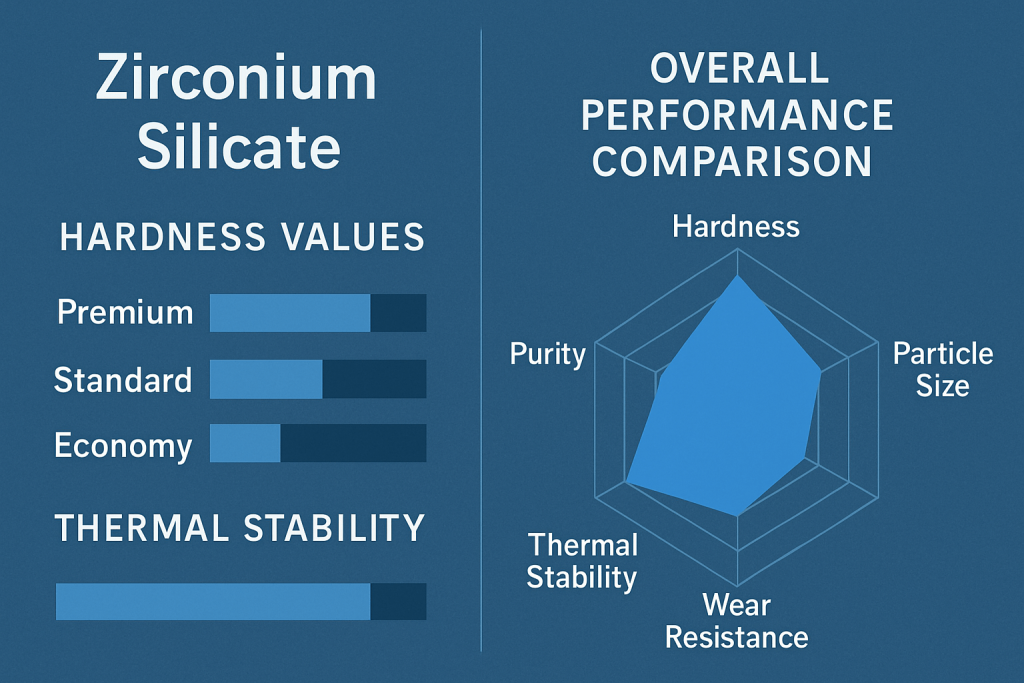
| Premium Grade | 65.0-66.5% | Fe2O3 (<0.05%), TiO2 (<0.10%), Al2O3 (<0.3%) | Highest whiteness, excellent thermal stability |
| Standard Grade | 64.0-65.0% | Fe2O3 (0.05-0.15%), TiO2 (0.10-0.25%), Al2O3 (0.3-0.8%) | Good whiteness, standard thermal properties |
| Economy Grade | 62.0-64.0% | Fe2O3 (0.15-0.30%), TiO2 (0.25-0.50%), Al2O3 (0.8-1.5%) | Reduced whiteness, adequate thermal stability |
| Technical Grade | 60.0-64.0% | Varies by application | Optimized for specific technical properties |
| Foundry Grade | 64.0-65.0% | Higher SiO2 content | Optimized for foundry applications |
Particle size distribution represents one of the most significant differentiators between competing products. Market leaders typically offer more consistent distributions with tighter control of both the median size (D50) and distribution width (span). Testing shows that products with identical D50 values can perform dramatically differently if their distribution spans vary. Narrower distributions generally provide more predictable processing behavior and consistent finished properties.
Thermal stability and resistance comparisons reveal performance gaps that become particularly evident under extreme conditions. Premium products typically maintain structural integrity at temperatures 50-100°C higher than standard grades and resist thermal cycling for 2-3 times more cycles before showing degradation.
Processing behavior variations become apparent during manufacturing. Some products disperse more readily in slurries, requiring less energy and fewer additives. Others sinter more efficiently, reducing energy consumption and cycle times. These differences can translate to 5-15% productivity improvements in high-volume manufacturing operations.
Which Manufacturing Processes Yield Superior Zirconium Silicate Quality?
The manufacturing process significantly influences zirconium silicate quality and performance characteristics. Understanding these production differences helps buyers identify products likely to deliver superior results in specific applications.
Raw material sourcing represents the foundation of product quality. Zirconium silicate derived from primary zircon sand deposits typically offers higher purity and more consistent properties than material recovered from secondary sources or byproduct streams. Australian and South African deposits generally yield higher-grade material than Southeast Asian sources, though exceptions exist within each region.
But here’s the key point – advanced processing techniques often matter more than raw material source in determining final product quality. Leading manufacturers employ proprietary beneficiation processes to remove impurities, control particle characteristics, and enhance specific properties. These processes may include multi-stage flotation, magnetic separation, chemical leaching, and thermal treatments.
| Processing Technique | Quality Impact | Performance Advantage | Typical Cost Premium |
|---|---|---|---|
| Multi-stage flotation | Removes trace minerals | Improved whiteness, reduced reactivity | 5-10% |
| High-intensity magnetic separation | Eliminates iron-bearing impurities | Enhanced color stability, reduced contamination | 3-8% |
| Chemical leaching | Dissolves surface contaminants | Improved dispersion, reduced variability | 8-15% |
| Controlled calcination | Stabilizes crystal structure | Enhanced thermal stability, reduced shrinkage | 10-20% |
| Precision classification | Controls particle size distribution | Application-specific optimization, improved consistency | 5-15% |
Quality control systems correlate strongly with benchmark performance. Manufacturers employing statistical process control (SPC) with 100% in-line monitoring typically produce more consistent products than those relying on batch sampling. The best performers implement closed-loop control systems that automatically adjust process parameters based on real-time quality measurements.
Proprietary technologies play a significant role in performance differentiation. Several market leaders have developed specialized processing techniques that enhance specific material properties. These include surface modification treatments that improve dispersion characteristics, microstructure control methods that enhance sintering behavior, and composite formulations that optimize application-specific properties.
Cost-efficiency analysis reveals that higher production costs don’t always translate to better performance. Some manufacturers achieve superior quality through process optimization and advanced quality control rather than more expensive raw materials or processing steps. This efficiency allows them to offer high-performance products at competitive prices.
How Do Application-Specific Requirements Influence Product Rankings?
Application requirements fundamentally shape how zirconium silicate products rank in performance benchmarking. A product that excels in one application may perform poorly in another due to different property priorities and processing conditions.
The ceramics industry represents one of the largest markets for zirconium silicate, using the material primarily as an opacifier and whitening agent. For these applications, optical properties (whiteness, opacity) and suspension stability typically determine performance rankings. Premium ceramic-grade products offer L* values above 94, opacity factors exceeding 0.85, and suspension stability sufficient to prevent settling for 24+ hours in properly formulated glazes.
What you’ll find interesting is that electronic materials have perhaps the most stringent requirements, demanding exceptional purity and consistency. Benchmarking for these applications focuses on electrical properties, trace contaminant levels, and batch-to-batch consistency. Leading products maintain impurity levels below 100 ppm for critical elements and property variations below 2% between production lots.
| Industry | Critical Performance Attributes | Typical Test Methods | Leading Product Characteristics |
|---|---|---|---|
| Ceramics | Whiteness (L* >94), opacity (>0.85), suspension stability | Spectrophotometry, sedimentation testing | Fine particle size (D50 1-5 μm), high purity, narrow distribution |
| Refractories | Thermal shock resistance, chemical stability, volume stability | Cyclic heating tests, cup tests, dilatometry | Coarser particle size (D50 45-150 μm), controlled impurities |
| Electronics | Electrical properties, purity, consistency | ICP-MS, electrical testing, statistical analysis | Ultra-fine particles (D50 0.5-2 μm), extremely high purity |
| Foundry | Surface finish, dimensional stability, gas permeability | Casting tests, permeability measurements | Medium particle size (D50 75-300 μm), controlled distribution |
| Coatings | Opacity, dispersion stability, abrasion resistance | Draw-down tests, accelerated wear testing | Fine particles (D50 1-10 μm), surface treatment |
Foundry industry requirements focus on surface finish quality and dimensional stability in molds and cores. Performance leaders provide consistent grain size distribution, minimal impurities that could cause surface defects, and controlled permeability characteristics. Testing typically involves actual casting trials rather than simple laboratory measurements.
Emerging applications continue to develop specialized performance criteria. Advanced catalysts, environmental remediation materials, and biomedical applications each require unique property combinations that may not align with traditional benchmarking parameters. For these applications, custom testing protocols often provide more relevant performance rankings than standardized industry tests.
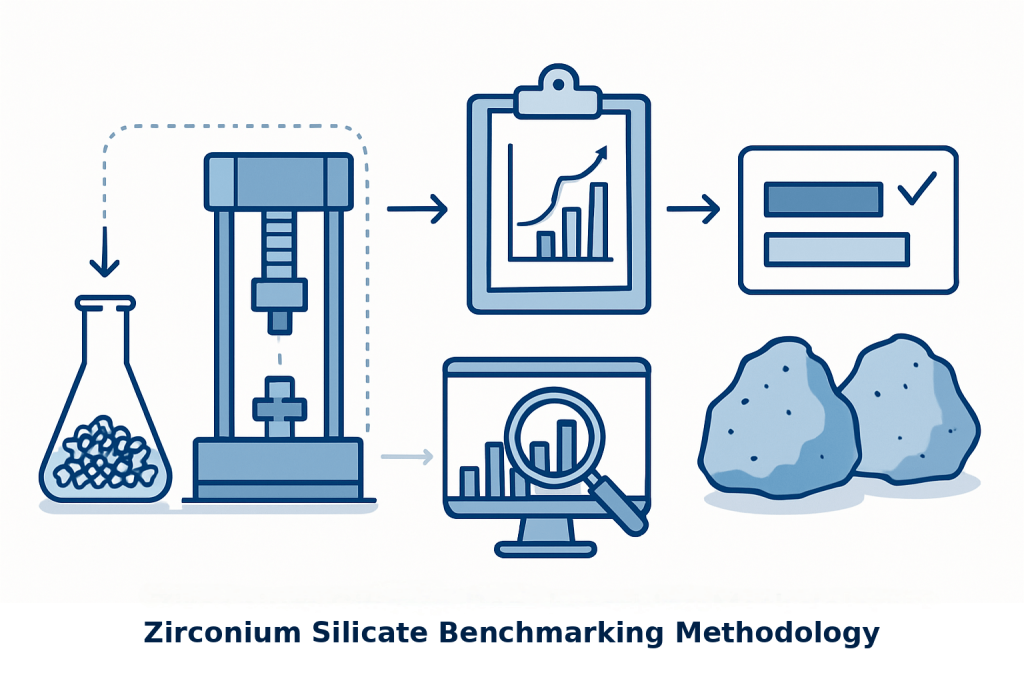
What Testing Methods Reveal True Performance Differences?
Testing methodology significantly influences benchmarking results and can either reveal or obscure meaningful performance differences between zirconium silicate products. Selecting appropriate evaluation techniques proves critical for identifying products that will perform best in specific applications.
Standard industry tests provide a useful baseline for comparison but often fail to capture application-specific performance differences. These tests typically measure fundamental properties under idealized conditions rather than simulating actual use environments. While valuable for quality control and specification compliance, standard tests may not predict field performance accurately.
The hard truth is that many standard tests lack the sensitivity to detect subtle but important differences between competing products. For example, conventional whiteness testing may not reveal metamerism issues (color shifts under different lighting conditions) that become apparent in finished products. Similarly, standard chemical resistance tests may not predict long-term stability under cyclic exposure conditions.
| Testing Approach | Advantages | Limitations | Best Applications |
|---|---|---|---|
| Standard Industry Tests | Reproducible, widely accepted, good for screening | May not predict field performance, limited sensitivity | Initial qualification, specification compliance |
| Application Simulation | Better correlation with actual use, reveals practical differences | More complex, less standardized, higher cost | Final selection, critical applications |
| Accelerated Testing | Faster results, stresses materials beyond normal conditions | May trigger different failure mechanisms, difficult correlation | Comparative ranking, failure mode analysis |
| Statistical Design of Experiments | Reveals interactions, optimizes formulations, efficient | Requires statistical expertise, larger sample sizes | Product development, formulation optimization |
| Field Testing | Most realistic conditions, direct performance evidence | Time-consuming, expensive, many variables | Critical applications, final validation |
Advanced analytical techniques provide deeper insights into material characteristics that influence performance. High-resolution microscopy reveals microstructural features that affect mechanical properties and sintering behavior. Thermal analysis techniques identify phase transitions and reaction kinetics that impact high-temperature stability. Spectroscopic methods detect trace impurities that can dramatically influence optical and electrical properties.
Real-world performance testing offers the most reliable benchmarking data but requires significant time and resources. Leading manufacturers and sophisticated users conduct parallel field trials under actual production conditions, tracking performance metrics over extended periods. These trials often reveal performance differences that laboratory testing missed, particularly in durability, consistency, and long-term stability.
Statistical significance in benchmarking data interpretation requires careful consideration. Many published benchmarking studies draw conclusions from inadequate sample sizes or fail to account for normal production variability. Reliable benchmarking requires testing multiple production lots from each manufacturer, using appropriate statistical methods to determine whether observed differences are meaningful.
Custom testing protocols designed for specific performance attributes often provide the most valuable benchmarking data. These protocols simulate actual application conditions and measure the specific properties that matter most for particular uses. While less standardized than industry tests, custom protocols typically offer better predictive value for field performance.
How Can Buyers Interpret Benchmarking Data for Procurement Decisions?
Translating technical benchmarking data into procurement decisions requires a structured approach that connects material properties to operational value. Effective interpretation bridges the gap between laboratory measurements and business outcomes.
Technical specifications provide the foundation for material evaluation but must be translated into operational terms. For example, a 5% improvement in thermal shock resistance might translate to 20% longer service life in high-temperature applications. Similarly, enhanced dispersion stability might reduce mixing time by 15% and improve finished product consistency by 8%. These operational translations help procurement teams justify premium prices for higher-performing materials.
Consider this practical example – a ceramic tile manufacturer switched to a higher-grade zirconium silicate that cost 12% more than their standard material. The improved product reduced glaze defects by 30%, decreased firing rejects by 15%, and allowed a 5% reduction in material usage through more efficient application. The net result was a 22% decrease in total production cost despite the higher material price.
| Benchmarking Parameter | Technical Improvement | Operational Value | Financial Impact |
|---|---|---|---|
| Whiteness (L* value) | +3 points | Reduced pigment usage, improved color consistency | 5-10% material cost reduction |
| Particle Size Control | D90/D10 ratio reduced from 12 to 8 | Fewer defects, improved dispersion | 10-20% reduction in rejects |
| Thermal Stability | 75°C higher temperature stability | Extended service life, reduced maintenance | 15-30% lower maintenance costs |
| Chemical Purity | Iron content reduced from 0.15% to 0.05% | Improved color stability, reduced contamination | Varies by application |
| Processing Behavior | 20% lower viscosity at equal solids loading | Faster processing, higher throughput | 5-15% productivity improvement |
Total cost of ownership calculations provide a more comprehensive view than simple purchase price comparisons. These calculations include direct material costs, processing impacts (energy, labor, cycle time), quality effects (yield, consistency, defect rates), and lifecycle considerations (maintenance, replacement frequency, disposal costs). For high-value applications, even small performance improvements can generate substantial cost savings over the material lifecycle.
Risk assessment frameworks help evaluate the potential downside of material selection decisions. These frameworks consider factors like supply chain reliability, batch-to-batch consistency, technical support quality, and manufacturer financial stability alongside performance data. For critical applications, risk factors may outweigh marginal performance advantages or modest cost savings.
Supplier capability assessment extends beyond current product specifications to evaluate a manufacturer’s ability to provide consistent quality, responsive technical support, and ongoing product development. Leading buyers evaluate production facilities, quality systems, research capabilities, and technical expertise as part of their supplier qualification process. These factors often predict long-term performance better than current product specifications alone.
Internal validation protocols provide the final link between benchmarking data and procurement decisions. Sophisticated buyers develop standardized procedures for evaluating new materials in their specific applications, typically including laboratory screening, pilot-scale trials, and monitored production implementation. These protocols ensure that benchmarking advantages translate to actual operational benefits.
What Future Trends Will Reshape Zirconium Silicate Performance Standards?
Emerging technologies and market forces are driving significant changes in how zirconium silicate performance is defined, measured, and optimized. Understanding these trends helps buyers anticipate future requirements and select products with long-term performance advantages.
New application technologies are creating demand for specialized performance characteristics that traditional benchmarking doesn’t address. Advanced 3D printing processes require zirconium silicate with precise flow characteristics and particle morphology. Next-generation electronic substrates need unprecedented purity levels and controlled electrical properties. Medical applications demand biocompatibility alongside traditional performance attributes.
What’s particularly notable is how sustainability metrics are entering benchmarking criteria. Environmental impact assessments now influence material selection alongside traditional performance parameters. Leading manufacturers are developing products with reduced energy requirements, lower emissions during production, and improved recyclability. These sustainability advantages increasingly factor into procurement decisions, especially for companies with strong environmental commitments.
| Emerging Trend | Current Status | Future Impact | Preparation Strategy |
|---|---|---|---|
| Sustainability Metrics | Becoming mandatory in some markets | Will likely become standard benchmarking criteria | Evaluate supplier environmental programs, request lifecycle assessments |
| Digital Material Passports | Early adoption phase | Will provide comprehensive material history and properties | Implement material tracking systems, request digital documentation |
| AI-Driven Formulation | Research stage for most applications | Will accelerate development of application-specific grades | Partner with technically advanced suppliers, invest in internal expertise |
| Nanoscale Engineering | Commercial in limited applications | Will enable unprecedented property combinations | Monitor developments in nano-zirconia technology, evaluate early applications |
| Circular Economy Requirements | Regulatory pressure increasing | Will require recyclability and reduced environmental impact | Assess material recyclability, develop reclamation processes |
Regulatory influences on product formulation and testing continue to expand. Restrictions on hazardous substances, workplace exposure limits, and environmental release regulations increasingly shape product development. Forward-thinking manufacturers are proactively reformulating products to meet anticipated regulatory requirements rather than reacting to mandates after they take effect.
Digital transformation in material testing and quality assurance is revolutionizing how performance is measured and verified. Advanced sensors, real-time monitoring systems, and automated testing equipment generate unprecedented data volumes on material properties and processing behavior. Artificial intelligence systems analyze these data streams to identify subtle performance patterns and optimization opportunities that traditional methods might miss.
Predictive performance modeling is gradually reducing reliance on empirical testing. Sophisticated simulation tools can now predict how material properties will influence manufacturing processes and finished product performance. These models accelerate product development, enable application-specific optimization, and help buyers select optimal materials without extensive physical testing. As these models improve, virtual benchmarking may partially replace traditional physical testing for routine applications.
Conclusion
Benchmarking data reveals significant performance differences between competing zirconium silicate products that directly impact manufacturing efficiency and product quality. By understanding how these differences affect specific applications, procurement teams can select materials that deliver optimal performance rather than simply meeting basic specifications. Our analysis shows that properly selected zirconium silicate products can reduce total production costs by 10-25% through improved processing efficiency, higher yields, and enhanced product performance.
For your next material selection decision, partner with Global Industry’s technical team to evaluate how our industry-leading zirconium silicate products can optimize your specific application. Request our comprehensive benchmarking report that compares performance across all major manufacturers using application-specific testing protocols. Contact us today to schedule an on-site assessment that will identify your best material option based on your unique processing conditions and performance requirements.
FAQ Section
Q1: How often should zirconium silicate benchmarking data be updated?
Benchmarking data for zirconium silicate products should be reviewed quarterly for market intelligence, but comprehensive technical evaluations are typically conducted annually. For rapidly evolving applications or when new suppliers enter the market, more frequent assessments may be necessary. Companies should establish a regular benchmarking calendar that aligns with their procurement cycles and product development timelines, while maintaining a database of historical performance data to identify long-term trends and stability issues.
Q2: What sample sizes provide statistically valid benchmarking results?
For reliable zirconium silicate benchmarking, a minimum of three production lots from each manufacturer should be tested, with each lot sampled at multiple points. Statistical validity typically requires 30+ data points per performance parameter, with outlier analysis and standard deviation calculations. For critical applications, this sample size should increase to 50+ measurements. Cross-validation between different testing methods strengthens data reliability, while blind testing protocols eliminate potential bias in subjective evaluations.
Q3: How do regional differences affect zirconium silicate benchmarking results?
Regional variations significantly impact benchmarking outcomes due to differences in raw material sources, manufacturing standards, and application requirements. Products from Australia, South Africa, and China often show distinct performance profiles based on ore characteristics. Testing protocols must account for these regional variations by standardizing evaluation conditions and normalizing results against reference materials. Buyers should consider regional performance differences when developing global sourcing strategies, as a product that performs well in one region may not maintain that performance when manufactured elsewhere.
Q4: Can benchmarking data predict long-term performance reliability?
While benchmarking provides valuable comparative data, it has limitations in predicting long-term reliability. Accelerated aging tests offer some predictive value but cannot fully replicate decades of real-world conditions. The most reliable approach combines benchmarking with historical performance tracking and failure analysis from actual applications. Companies should maintain performance databases spanning 5+ years to identify subtle degradation patterns and establish correlations between initial benchmarking results and long-term field performance.
Q5: How should cost considerations be integrated into performance benchmarking?
Performance-to-cost ratio analysis provides the most valuable procurement insights, rather than viewing performance or cost in isolation. This approach requires quantifying the economic value of performance improvements in specific applications. For example, a 5% increase in zirconium silicate performance might translate to 15% longer service life in refractories or 8% higher production yields in ceramics. Sophisticated buyers develop application-specific value models that assign monetary values to performance increments, enabling data-driven decisions that balance technical performance with economic considerations.