For B2B buyers in manufacturing, ceramics, and refractories, staying ahead of material cost trends isn’t optional. It’s mandatory. One raw material raising consistent concern is zircon sand. Known for its high thermal resistance and chemical stability, it’s vital in various industrial applications—but also subject to sharp price movements. Many procurement managers ask: what’s driving these price shifts through the 2020s?
This article offers clear insights. You’ll see what shapes global zircon demand, how supply chain dynamics affect cost, and what procurement strategies can help contain risk. You’ll also gain a practical outlook on price patterns by region and industry. This is backed by production data, trade pressures, and current mining developments. I’ve advised global clients on raw material sourcing for over 15 years. That experience gives me the insight to simplify complexity—and help you make informed buying decisions.
Let’s break it down clearly.
What global factors shape zircon sand demand?
Zircon sand demand ties directly to end-use sectors like ceramics, refractories, and foundries. These industries rely on its durability, high melting point, and chemical stability. So what’s the real driver here? When GDP growth picks up in Asia or Europe, ceramic tile manufacturing rises, triggering higher zircon usage.
Here’s how it unfolds:
- Ceramics: Used to opacify glazes in tiles and sanitaryware. China, India, and Southeast Asia are the largest tile producers, making this a top demand engine.
- Foundries: Zircon is used in mold coatings for steel and precision casting. As auto and machinery sectors grow, so does zircon consumption.
- Refractories: High-temperature materials for kilns and furnaces depend on zircon’s heat resistance.
| Industry Use Case | Zircon Consumption Share (%) |
|---|---|
| Ceramics (tiles, sanitary) | 50% |
| Foundry applications | 25% |
| Refractories | 15% |
| Chemicals and others | 10% |
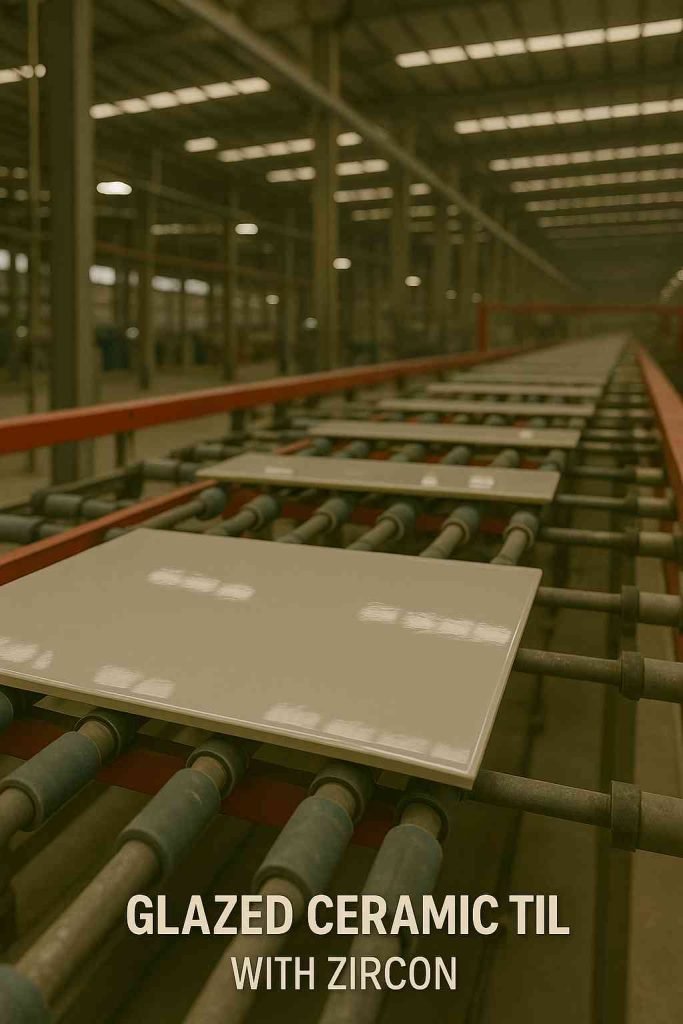
This image shows how zircon is used in glazes for ceramic tiles produced in large-scale Asian plants.
Demand is also influenced by seasonal cycles. For instance, ceramic output surges before major housing or export seasons. And in recent years, stimulus spending on construction in India and Indonesia has lifted zircon imports.
How does supply chain stability affect pricing?
Zircon is not evenly distributed across the globe. Most of the supply comes from a handful of countries, which makes the market vulnerable to regional disruptions. Here’s what that means for buyers. When shipping lanes close, or export policies change, the ripple effects show up in spot pricing fast.
Top producers include:
- Australia (Iluka Resources)
- South Africa (Richards Bay Minerals)
- Mozambique (Moma mine)
If these countries face drought, labor strikes, or political unrest, zircon shipments fall. In 2022, cyclone damage to a key port in Mozambique led to a 14% drop in export volumes over three months.
| Major Producer | Estimated Annual Output (kt) | Main Export Market |
|---|---|---|
| Australia | 400 | China, EU |
| South Africa | 300 | India, Middle East |
| Mozambique | 200 | Southeast Asia |
Supply chains are also exposed to energy costs and shipping fees. If bunker fuel prices spike, so do freight charges, impacting CIF (Cost, Insurance, Freight) values for buyers.
What’s happening in the zircon sand mining sector?
Mining costs and capacity shifts directly shape zircon pricing. Let’s take a closer look. Australia’s Iluka is still the global leader, but it has limited new mine expansions due to environmental controls. Meanwhile, African countries are opening new sites, but face infrastructure gaps.
Tech improvements help recover more zircon from tailings or low-grade deposits. But this raises operational costs.
Some current developments:
- South Africa is tightening water use rules around mines.
- India is increasing import duty to protect local miners.
- Indonesia has placed temporary export restrictions.
| Region | Development Stage | Note |
|---|---|---|
| Australia | Mature, steady output | No new major sites until 2026 |
| Africa | Growth stage | Investment up, but logistics lagging |
| SE Asia | Regulatory headwinds | High-grade deposits, but policy risk |
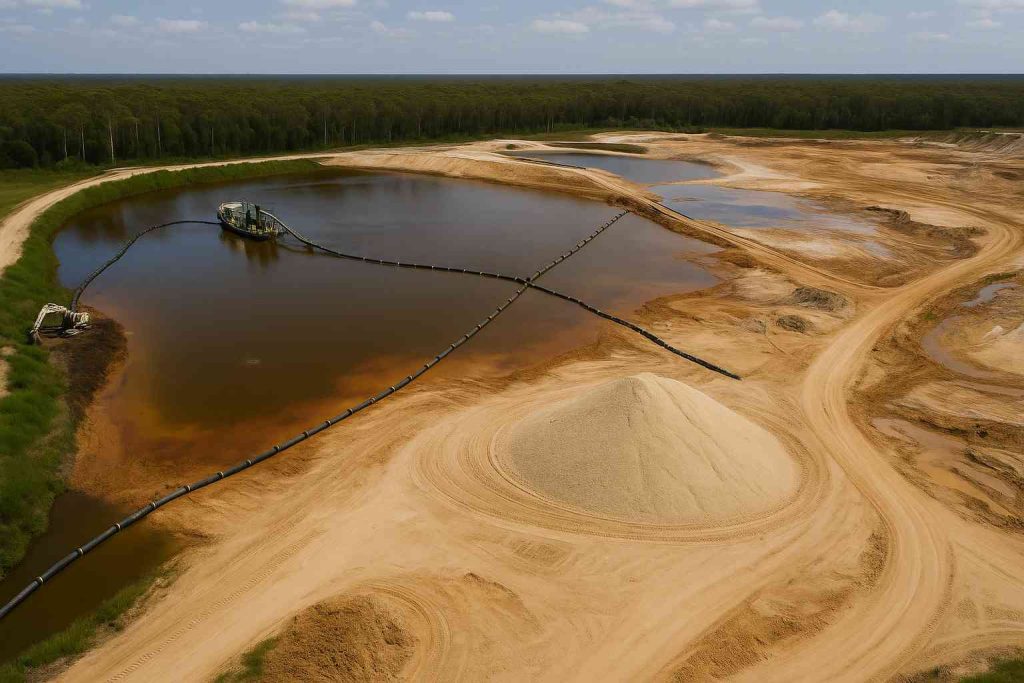
This image shows an aerial view of a zircon sand extraction site with active dredging operations.
Mining investment will remain cautious until global demand justifies new capacity. Until then, tight supply will remain the norm.
Are substitutes influencing zircon sand demand?
Yes, but they aren’t replacing zircon entirely. Here’s why that matters. Buyers are always looking for cheaper or more sustainable inputs. That said, performance matters. Zircon has no perfect substitute in many applications.
Alternatives include:
- Kaolin: Cheaper, used in ceramics, but lacks durability
- Calcined alumina: High performance, but more expensive
- Silica flour: Used in foundry work, but lower thermal resistance
| Substitute | Cost (per ton) | Application Fit | Drawback |
|---|---|---|---|
| Kaolin | \$90–120 | Ceramic base | Low durability, color limitations |
| Calcined Alumina | \$400+ | Refractories, coatings | High cost |
| Silica Flour | \$80–100 | Foundry mold fillers | Melts at lower temps |
Substitutes are sometimes blended with zircon to cut cost. But this impacts quality, especially in glazes or precision castings. So in most B2B sourcing decisions, zircon remains the benchmark material.
How are pricing trends evolving by region?
Regional pricing varies by freight cost, demand, and local manufacturing patterns. Let’s break this down. China’s prices tend to lead due to volume and contract size. Europe’s prices are higher due to strict import duties and limited processing.
Examples by region:
- Asia-Pacific: Lower prices due to proximity to Australia and Mozambique
- Europe: High costs tied to energy prices and regulatory fees
- North America: Stable demand, mid-tier prices
| Region | Avg. Import Price (USD/ton) | Primary Use Sector |
|---|---|---|
| China | \$1,550 | Tiles, pigments |
| EU | \$1,720 | Ceramics, foundry |
| USA | \$1,600 | Refractories, investment |
Regional price differences also depend on port charges, import taxes, and currency fluctuations. This means sourcing strategies must be region-specific—not just product-specific.
What are buyers doing to manage price risk?
Professional buyers use multiple strategies to manage risk. Let’s walk through a few. The most common is mixing short-term and long-term contracts. This gives price stability but also access to spot markets when rates drop.
Some procurement strategies include:
- Annual contracts with volume guarantees
- Backup suppliers from other continents
- Inventory buffers to absorb lead time delays
| Strategy | Benefit | Risk or Cost |
|---|---|---|
| Long-term contracts | Stable pricing | Less flexibility |
| Spot purchases | Capitalize on dips | Price spikes possible |
| Supplier diversification | Less disruption risk | Higher logistics overhead |
Buyers are also using commodity price tracking tools. Some hire independent consultants for forecasting. With accurate data, sourcing teams can make quicker pivots.
Will sustainability concerns reshape the market?
Zircon mining has environmental impacts. Water use, radiation levels, and land disturbance are major concerns. Here’s what’s changing now. More buyers are requesting ESG (Environmental, Social, Governance) reporting from their suppliers.
This impacts:
- Certifications: Like ISO14001 or country-specific eco-labels
- Recycled zircon: Still rare but growing in investment
- Sourcing audits: For suppliers to retain contracts
| ESG Factor | Industry Response |
|---|---|
| Water and emissions | New processing tech in Australia |
| Land restoration | African miners pledging reforestation |
| Health and safety | Regular audits, stricter PPE rules |
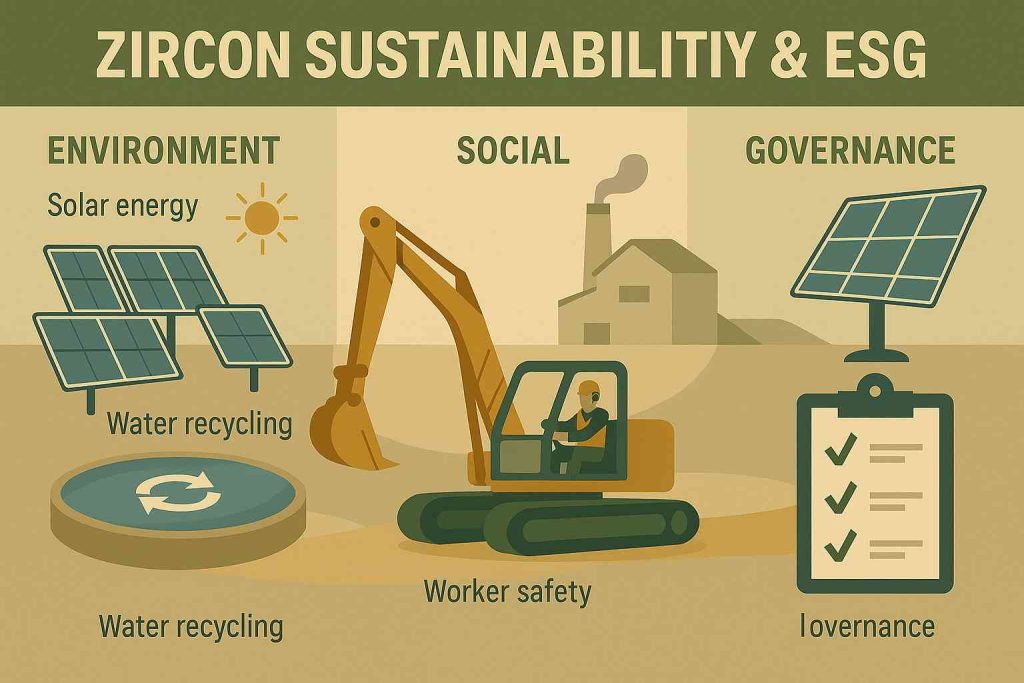
This image depicts a mining operation that has integrated solar power and water recycling systems.
These trends don’t just affect price—they influence supplier selection. Buyers should factor sustainability into risk models and contract terms.
How should purchasing managers prepare for 2025?
Market dynamics will stay complex. That’s why preparation matters more than prediction. Let’s talk about real actions.
Key recommendations:
- Use forecasting tools with real-time commodity data
- Maintain flexible sourcing channels
- Invest in category management training
Collaborate across departments. Procurement, R\&D, and operations should share zircon usage forecasts and scenario plans.
| Action Step | Advantage |
|---|---|
| Forecasting tool adoption | Faster sourcing decisions |
| Flexible supplier pool | Reduced single-point failure risk |
| R\&D coordination | Better substitute integration |
Buyers who prepare with data and collaboration will secure more stable supply and better cost positions in the years ahead.
Conclusion
Through this article, I’ve examined how zircon sand pricing is shaped by supply chains, global demand, substitutes, regional markets, and sustainability concerns. One key takeaway is clear: the zircon market remains tight, and buyers need to plan carefully. At Global Industry, we support clients with sourcing guidance and procurement planning tools that evolve with market dynamics. Contact us today for customized forecasting support—or ask about our supplier evaluation frameworks. Let’s work together to build supply security into your next contract cycle.
FAQ
Q1: Why is zircon sand used in industrial applications?
Zircon sand is valued for its resistance to high temperatures and corrosion. This makes it ideal for ceramics, where it enhances opacity and surface finish. It’s also critical in foundry work and refractories, where it withstands thermal shock and chemical wear. These properties make it a reliable material in harsh industrial conditions.
Q2: What countries dominate zircon sand production?
Australia leads the global market with consistent high-grade supply. South Africa and Mozambique follow, offering growing capacity and lower-cost operations. These countries not only have large reserves but also developed export infrastructures. Their political stability and mining regulations also influence buyer preferences.
Q3: Are there risks of zircon supply shortages?
Yes, several. Disruptions from natural disasters, local labor issues, or export bans can quickly impact supply. Additionally, as zircon is mined with other heavy minerals, co-production dependencies affect its availability. Limited new mine development adds to long-term risk unless demand stabilizes or substitutes mature.
Q4: How do buyers forecast zircon sand price changes?
Buyers track global production volumes, export data, and trends in end-use industries. They also monitor macroeconomic indicators like construction growth and currency strength in exporting nations. Some use commodity analytics platforms and negotiate blended pricing strategies to handle market fluctuations.
Q5: What’s the outlook for zircon sand prices through 2030?
Expect prices to remain volatile. Global demand will likely climb, especially in Asia-Pacific, while new supply remains constrained. Environmental costs and shipping volatility will also influence landed prices. Procurement teams should build cost buffers and renegotiation clauses into their contracts to adapt more effectively.