Zircon powder procurement decisions directly impact your manufacturing costs and product quality. Here’s what you need to know: identifying the right zircon powder suppliers requires understanding market leadership, production capabilities, and competitive positioning. This analysis reveals the top 5 global zircon powder producers, their market shares, and strategic advantages that matter most for B2B buyers. Our research draws from industry reports, company financials, and expert analysis to provide actionable zircon powder supplier intelligence for purchasing managers.
Global Zircon Powder Market Overview
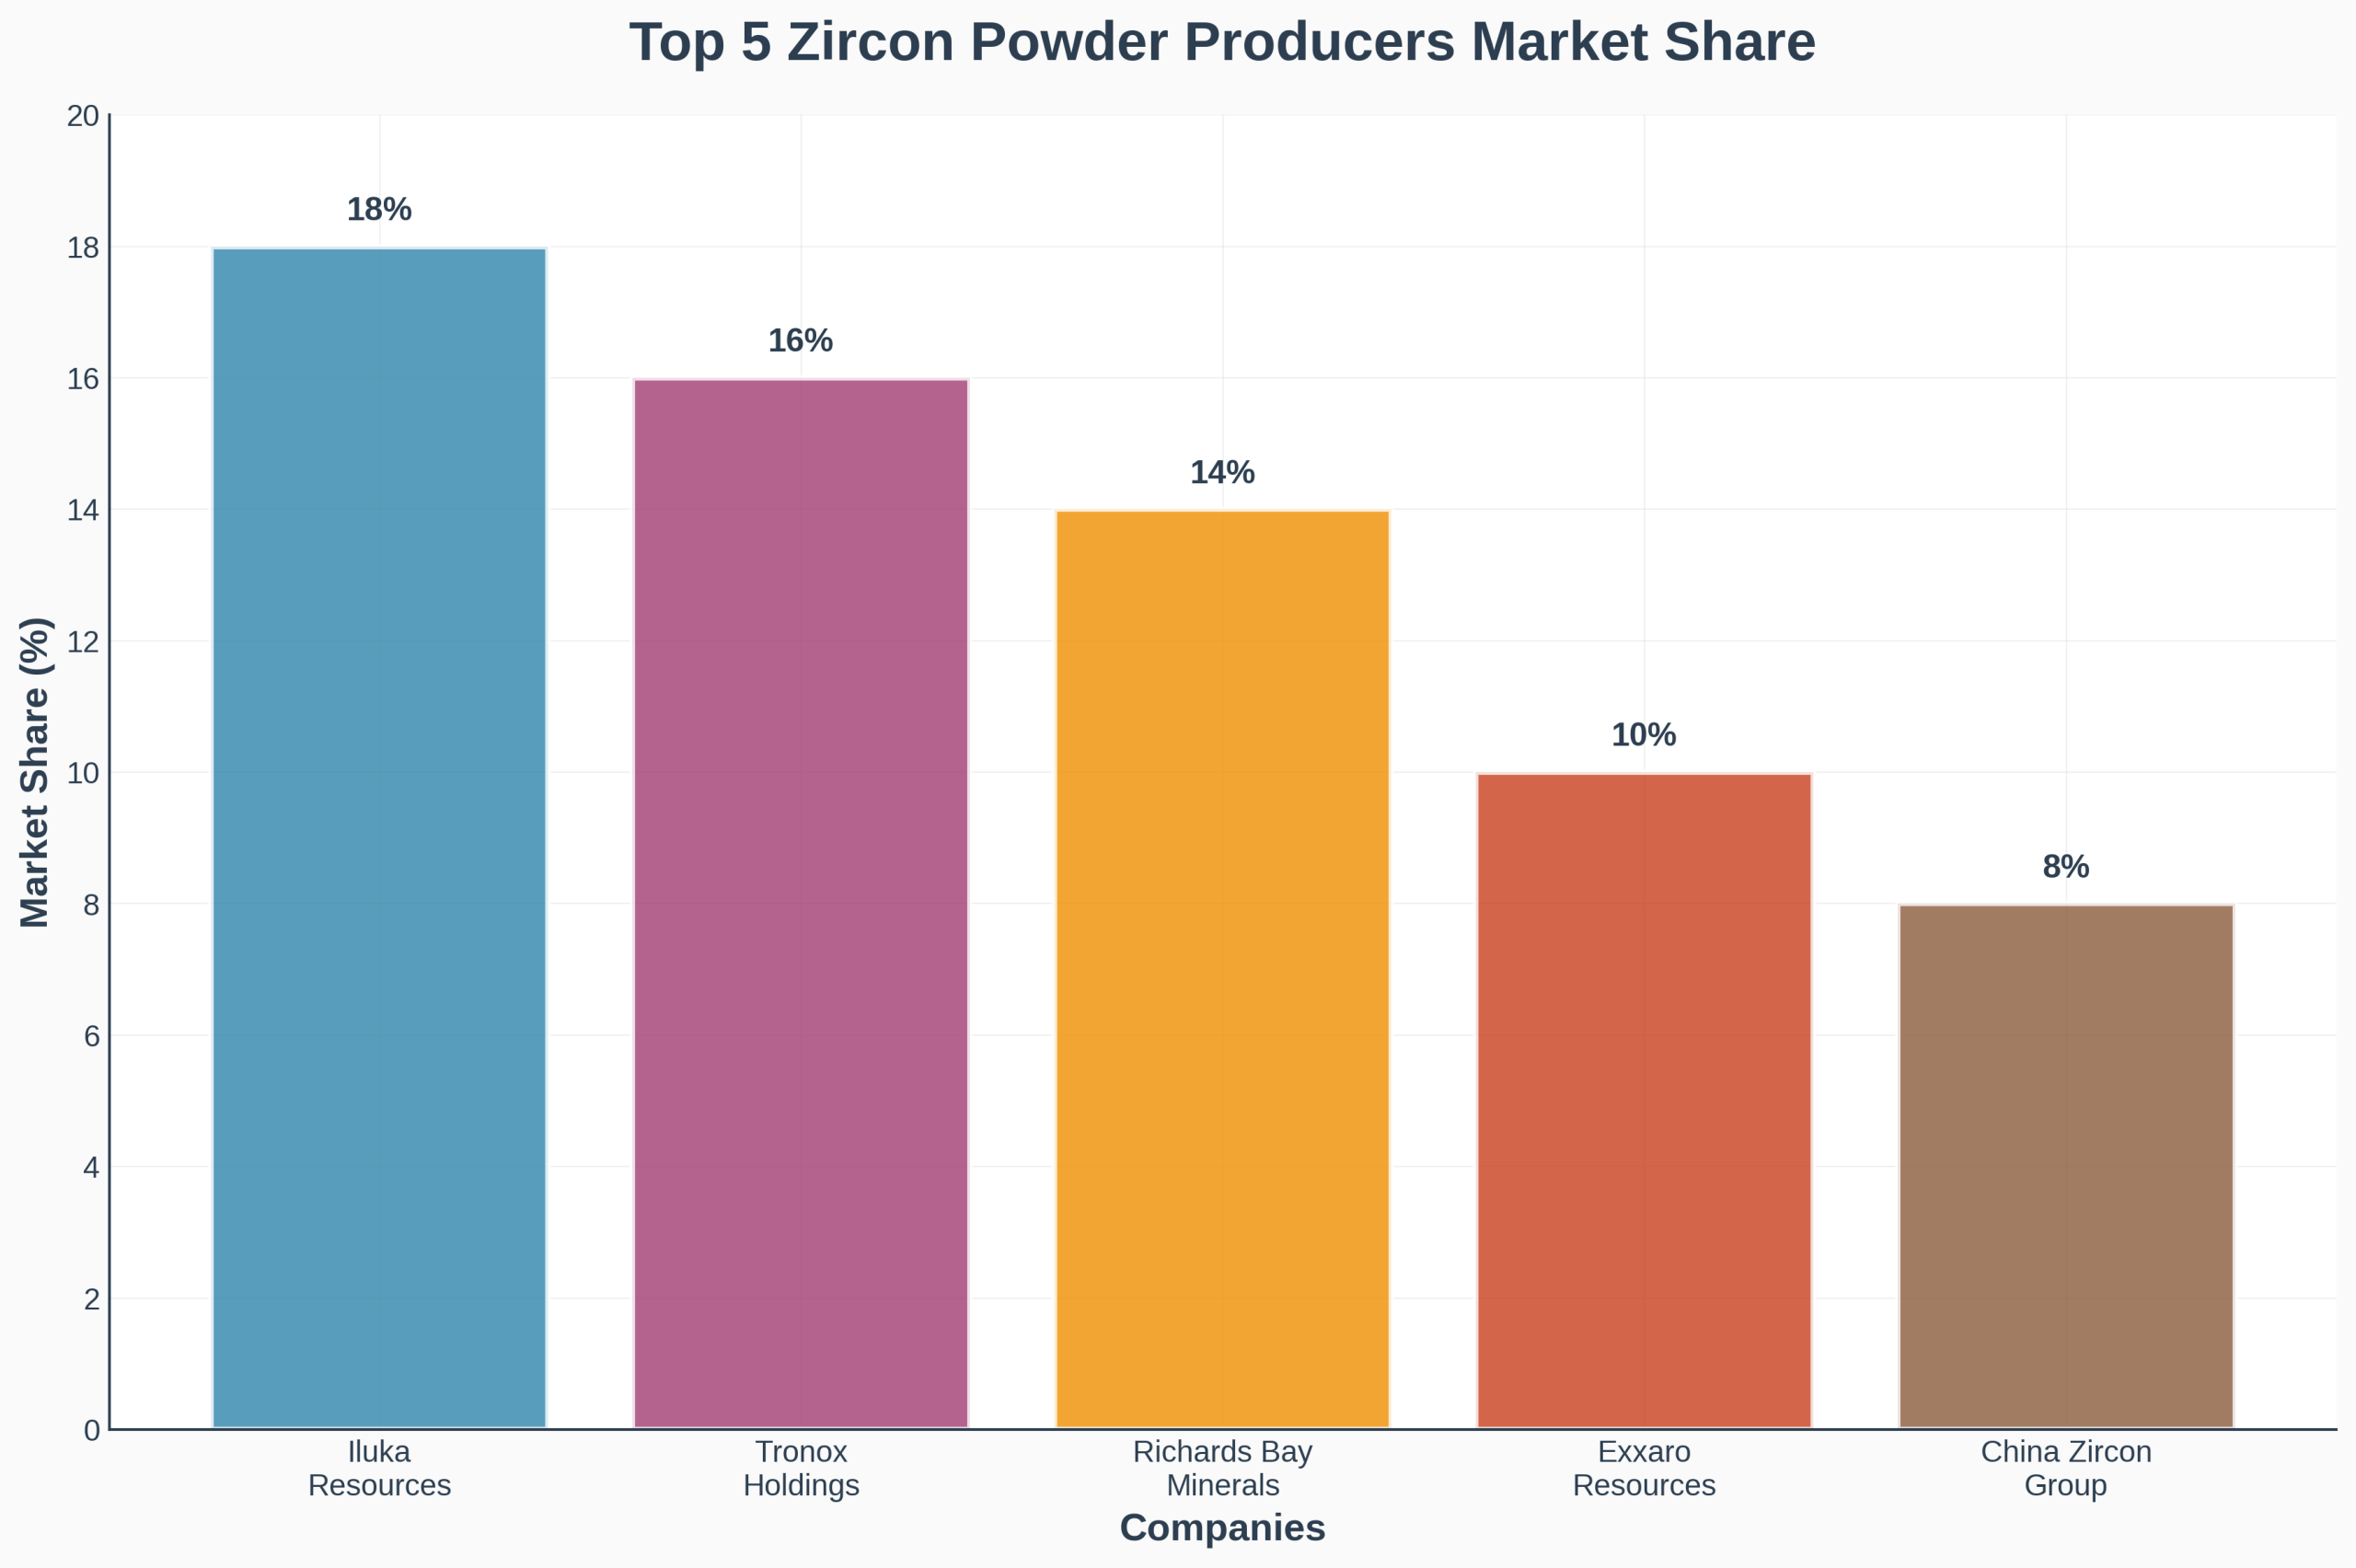
The global zircon powder market reached $1.8 billion in 2024, with annual growth rates averaging 4.2% over the past five years. But here’s the interesting part: zircon powder market concentration remains high, with the top 5 producers controlling approximately 68% of global production capacity.
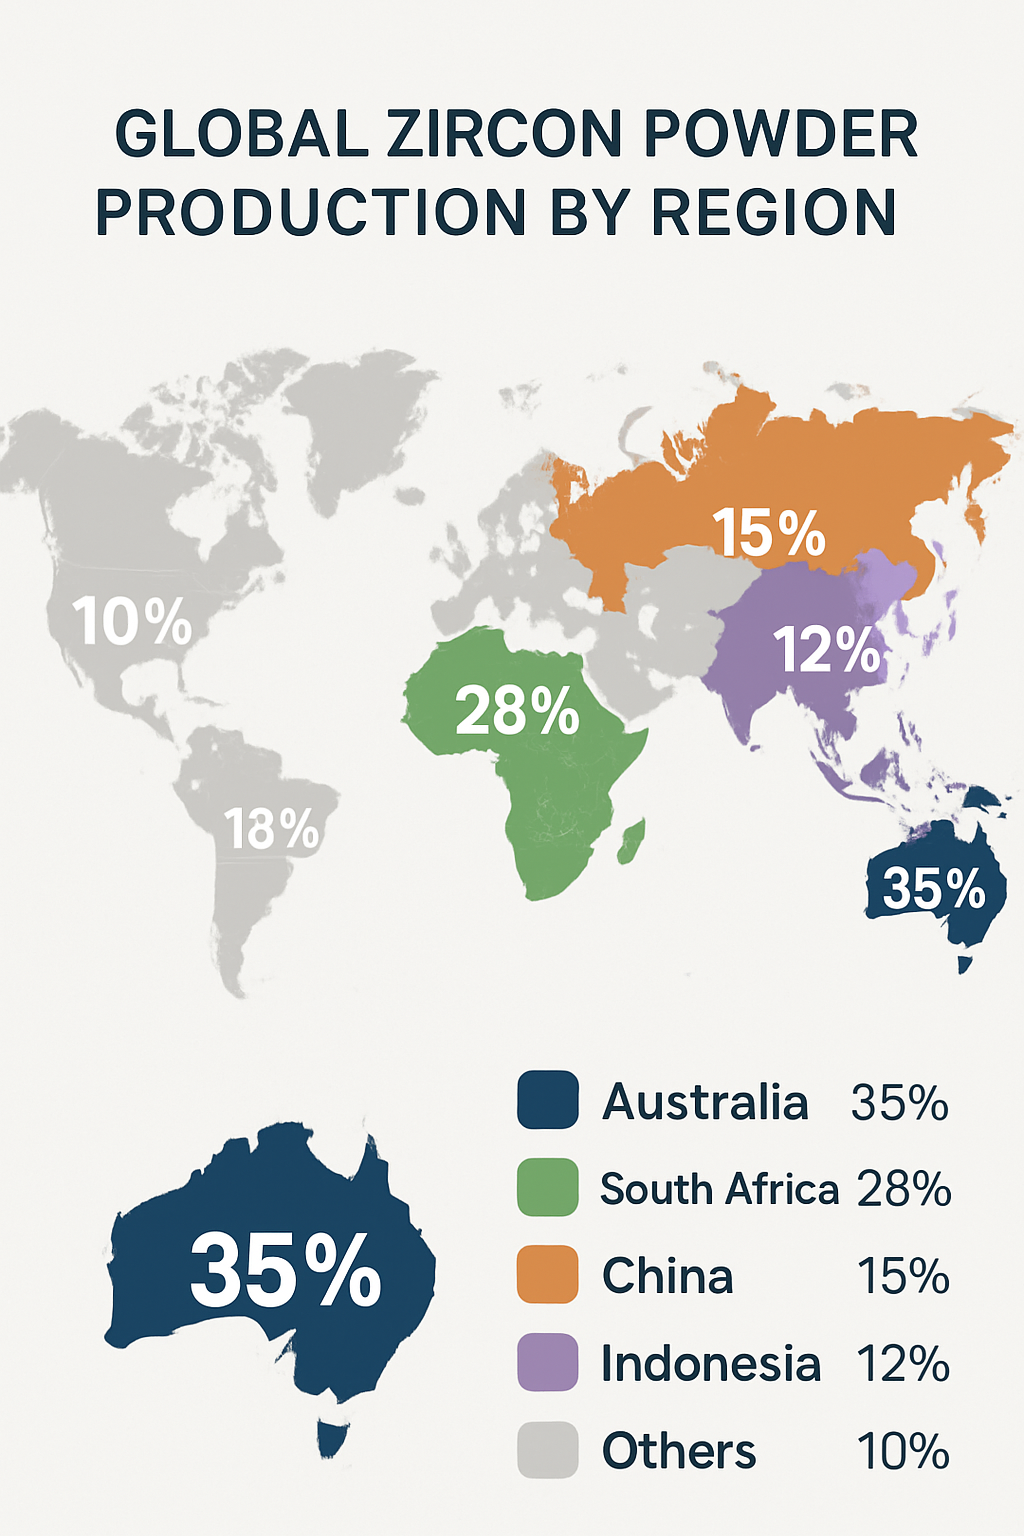
Geographic distribution shows clear production patterns. Australia leads global production with 35% market share, followed by South Africa at 28%, and China at 15%. The remaining production spreads across Indonesia, India, and smaller regional players.
Key application sectors drive consistent demand growth. Foundry casting applications account for 45% of total consumption, while ceramics and refractories represent 32%. Chemical processing uses 15% of output, with nuclear and specialty applications making up the remaining 8%.
| Region | Production Share | Key Producers | Annual Capacity (MT) |
|---|---|---|---|
| Australia | 35% | Iluka Resources, Tronox | 420,000 |
| South Africa | 28% | Richards Bay Minerals, Exxaro | 336,000 |
| China | 15% | Various regional players | 180,000 |
| Indonesia | 12% | PT Timah, local miners | 144,000 |
| Others | 10% | Multiple small producers | 120,000 |
Market value projections through 2030 indicate continued growth, reaching an estimated $2.4 billion driven by expanding industrial applications and emerging market demand. Regional consumption patterns show Asia-Pacific consuming 52% of global production, North America 23%, and Europe 18%. What’s driving this growth? Expanding foundry operations in developing markets, increasing demand for high-performance ceramics in aerospace applications, and growing chemical processing capacity in Asia. Supply chain dynamics influence market structure significantly, with integrated producers controlling mining, processing, and distribution operations.
Who Are the Top 5 Market Leaders?
Market leadership in zircon powder reflects both production scale and strategic positioning. Let’s break down the facts: these five companies dominate global supply chains through integrated operations, advanced processing capabilities, and established customer relationships.
Iluka Resources (Australia) holds the largest market position with 18% global share. Founded in 1954, the company operates multiple mining sites across Australia and produces approximately 216,000 metric tons annually. Their revenue from operations reached $485 million in 2023, supported by premium product grades and long-term customer contracts.
Tronox Holdings (Global) maintains 16% market share through vertically integrated operations spanning mining, processing, and distribution. With headquarters in Connecticut and major operations in Australia and South Africa, Tronox produces 192,000 metric tons annually. Their 2023 revenue totaled $432 million.
Richards Bay Minerals (South Africa) captures 14% market share as a joint venture between Rio Tinto and Blue Horizon Investments. Operating since 1976, RBM produces 168,000 metric tons annually from coastal mining operations. Their geographic advantage provides cost-effective access to European and Middle Eastern markets.
| Company | Market Share | Annual Production (MT) | 2023 Revenue ($M) | Key Regions |
|---|---|---|---|---|
| Iluka Resources | 18% | 216,000 | 485 | Australia, Asia-Pacific |
| Tronox Holdings | 16% | 192,000 | 432 | Global operations |
| Richards Bay Minerals | 14% | 168,000 | 378 | Africa, Europe, Middle East |
| Exxaro Resources | 10% | 120,000 | 285 | Africa, Asia |
| China Zircon Group | 8% | 96,000 | 215 | China, Southeast Asia |
Exxaro Resources (South Africa) holds 10% market share through diversified mineral operations including production. The company produces 120,000 metric tons annually, focusing on consistent quality and reliable delivery schedules. Their integrated logistics network supports efficient distribution across African and Asian markets.
China Zircon Group represents consolidated Chinese production with 8% global market share. Here’s what makes them different: lower production costs and proximity to major consumption centers in Asia. Annual production reaches 96,000 metric tons, primarily serving domestic foundry and ceramics industries.
What Production Capabilities Set Leaders Apart?
Production capabilities determine market leadership through technology, efficiency, and quality control systems. The bottom line is this: successful producers combine advanced processing methods with consistent output quality and cost management.
Manufacturing technology varies among top producers. Iluka Resources operates state-of-the-art dry processing plants that minimize environmental impact while maximizing recovery rates. Their spiral concentration and magnetic separation systems achieve 99.2% purity levels consistently. Tronox employs similar technology but adds electrostatic separation for specialty grades.
Quality control systems reflect industry-leading standards. All top 5 producers maintain ISO 9001:2015 certification, with additional certifications for specific applications. Nuclear-grade zircon powder requires ASTM C992 compliance, while foundry applications follow AFS standards. What does this mean for buyers? Consistent product specifications and reliable performance across different applications.
| Capability Factor | Iluka | Tronox | RBM | Exxaro | China Group |
|---|---|---|---|---|---|
| Processing Technology | Advanced dry processing | Electrostatic separation | Wet processing | Integrated operations | Cost-optimized |
| Quality Certification | ISO 9001, ASTM C992 | ISO 9001, AFS standards | ISO 9001, CE marking | ISO 9001, SABS | GB standards |
| Recovery Rate | 92% | 89% | 85% | 87% | 83% |
| Purity Levels | 99.2% | 99.0% | 98.8% | 98.9% | 98.5% |
Raw material sourcing strategies create competitive advantages. Australian producers benefit from high-grade heavy mineral sands with zircon concentrations exceeding 45%. South African operations work with lower-grade ores but compensate through efficient processing and economies of scale.
Environmental compliance and sustainability practices increasingly influence production capabilities. Leading producers invest in water recycling, dust control, and land rehabilitation programs. Here’s why this matters: regulatory requirements tighten globally, and customers prioritize suppliers with strong environmental records.
Regional market dynamics reveal significant variations in producer dominance and competitive positioning. The key insight here: geographic proximity, trade relationships, and local regulations shape market share distribution across different regions.
Asia-Pacific market shows Australian producer dominance, with Iluka and Tronox controlling 45% combined regional share. China’s domestic consumption drives local producer growth, but quality requirements for premium applications favor imported materials. Japanese and South Korean foundries prefer Australian zircon powder for automotive casting applications.
North American consumption patterns favor diversified sourcing strategies. Tronox’s integrated operations provide 35% of regional supply, while imports from Australia and South Africa fill remaining demand. What’s interesting about this market? Long-term contracts dominate, with foundries securing 2-3 year supply agreements to ensure price stability.
| Region | Leading Producer | Market Share | Key Applications | Growth Rate |
|---|---|---|---|---|
| Asia-Pacific | Iluka Resources | 22% | Foundry, ceramics | 5.8% |
| North America | Tronox Holdings | 35% | Foundry, chemicals | 3.2% |
| Europe | Richards Bay Minerals | 28% | Foundry, refractories | 2.9% |
| Middle East & Africa | Exxaro Resources | 31% | Foundry, construction | 6.1% |
European market dynamics reflect environmental regulations and quality standards. Richards Bay Minerals leads with 28% regional share, benefiting from established trade relationships and competitive shipping costs. European foundries require strict quality certifications, creating barriers for some Asian producers but opportunities for premium suppliers.
Middle East and Africa markets show strong growth potential, with local producers maintaining competitive advantages. Exxaro Resources dominates regional supply with 31% share, while growing industrial sectors drive 6.1% annual demand growth.
What Competitive Strategies Drive Success?
Successful producers employ distinct competitive strategies that create sustainable market advantages. The reality is: price competition alone doesn’t determine market leadership; value-added services, quality consistency, and strategic partnerships drive long-term success.
Pricing strategies reflect different market positioning approaches. Premium producers like Iluka command 8-12% price premiums through superior quality and technical support. Their pricing model emphasizes total cost of ownership rather than unit price, highlighting reduced waste, consistent performance, and technical assistance value.
Product differentiation strategies focus on specialized grades and applications. Tronox develops custom formulations for specific foundry applications, while Richards Bay Minerals offers pre-treated materials for ceramics manufacturing. What makes this strategy work? Close collaboration with customers to understand application requirements and develop tailored solutions.
| Strategy Element | Premium Approach | Volume Approach | Niche Approach |
|---|---|---|---|
| Pricing Model | Value-based premium | Cost-plus competitive | Application-specific |
| Product Range | Standard + custom grades | Standard grades only | Specialized products |
| Customer Service | Technical support included | Basic service | Expert consultation |
| Contract Terms | 2-3 year agreements | Annual contracts | Project-based |
Research and development investments create competitive differentiation. Leading producers allocate 2-4% of revenue to R&D activities, focusing on processing improvements, new applications, and environmental compliance. Strategic partnerships and joint ventures expand market reach and capabilities while sharing risks and investments.
Which Applications Generate Highest Revenues?
Application-specific demand patterns determine revenue generation and market opportunities for zircon powder producers. The key point here: understanding end-use applications helps zircon powder buyers identify suppliers with relevant expertise and production capabilities.
Foundry casting applications dominate zircon powder revenue generation, accounting for 45% of total market value. Steel foundries use zircon powder for investment casting shells, requiring consistent particle size distribution and low thermal expansion. What drives this zircon powder demand? Growing automotive production and increasing complexity of cast components.
Ceramics and refractory applications represent 32% of market revenue, with distinct quality requirements. Technical ceramics for electronics require ultra-high purity levels exceeding 99.5%, while refractory applications prioritize thermal shock resistance.
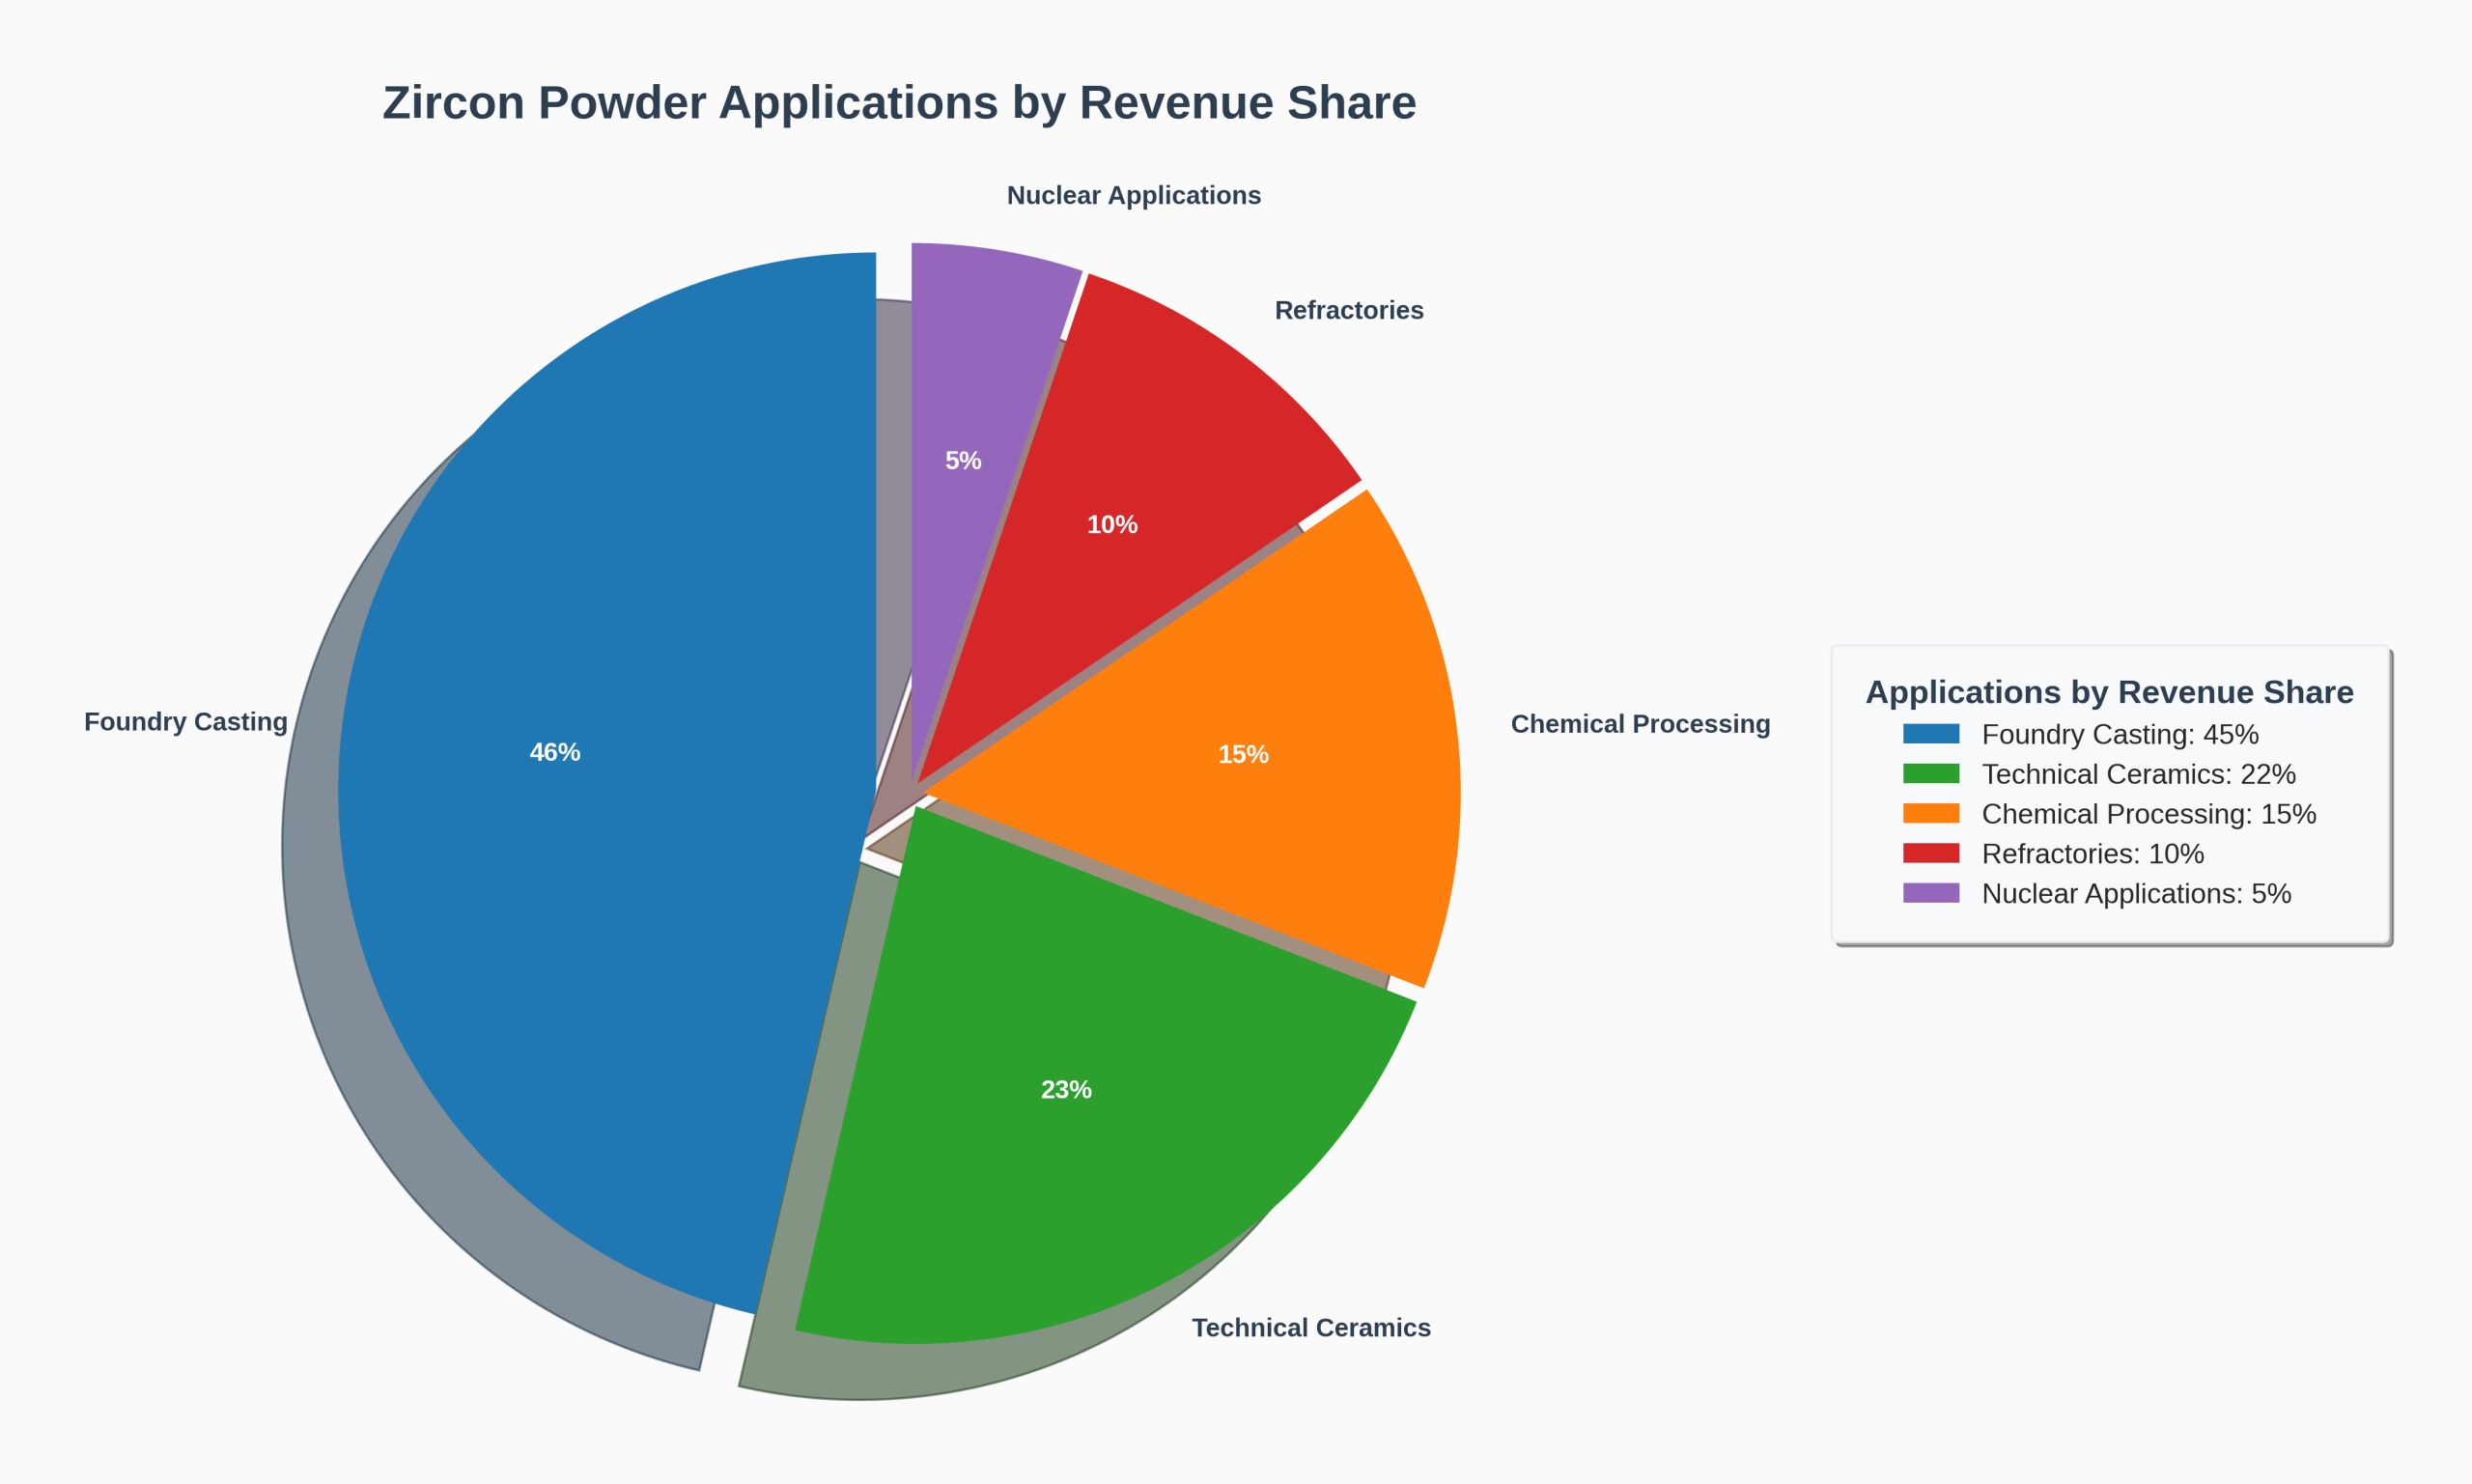
| Application | Revenue Share | Quality Requirements | Key Customers | Growth Rate |
|---|---|---|---|---|
| Foundry Casting | 45% | Consistent particle size | Steel foundries, automotive | 4.1% |
| Technical Ceramics | 22% | Ultra-high purity | Electronics, aerospace | 6.2% |
| Refractories | 10% | Thermal shock resistance | Steel, glass industries | 2.8% |
| Chemical Processing | 15% | Specific particle size | Chemical manufacturers | 7.3% |
| Nuclear Applications | 5% | Nuclear-grade purity | Nuclear industry | 1.9% |
Chemical processing applications generate 15% of market revenue through catalyst production and chemical intermediates. Here’s what’s interesting: this segment shows highest growth rates due to expanding chemical processing capacity in Asia.
Nuclear industry applications require specialized grades with stringent quality control. Nuclear-grade materials must meet ASTM C992 specifications for hafnium content below 100 ppm. Why does this matter? Nuclear applications command highest prices but require extensive certification and supply chain security measures.
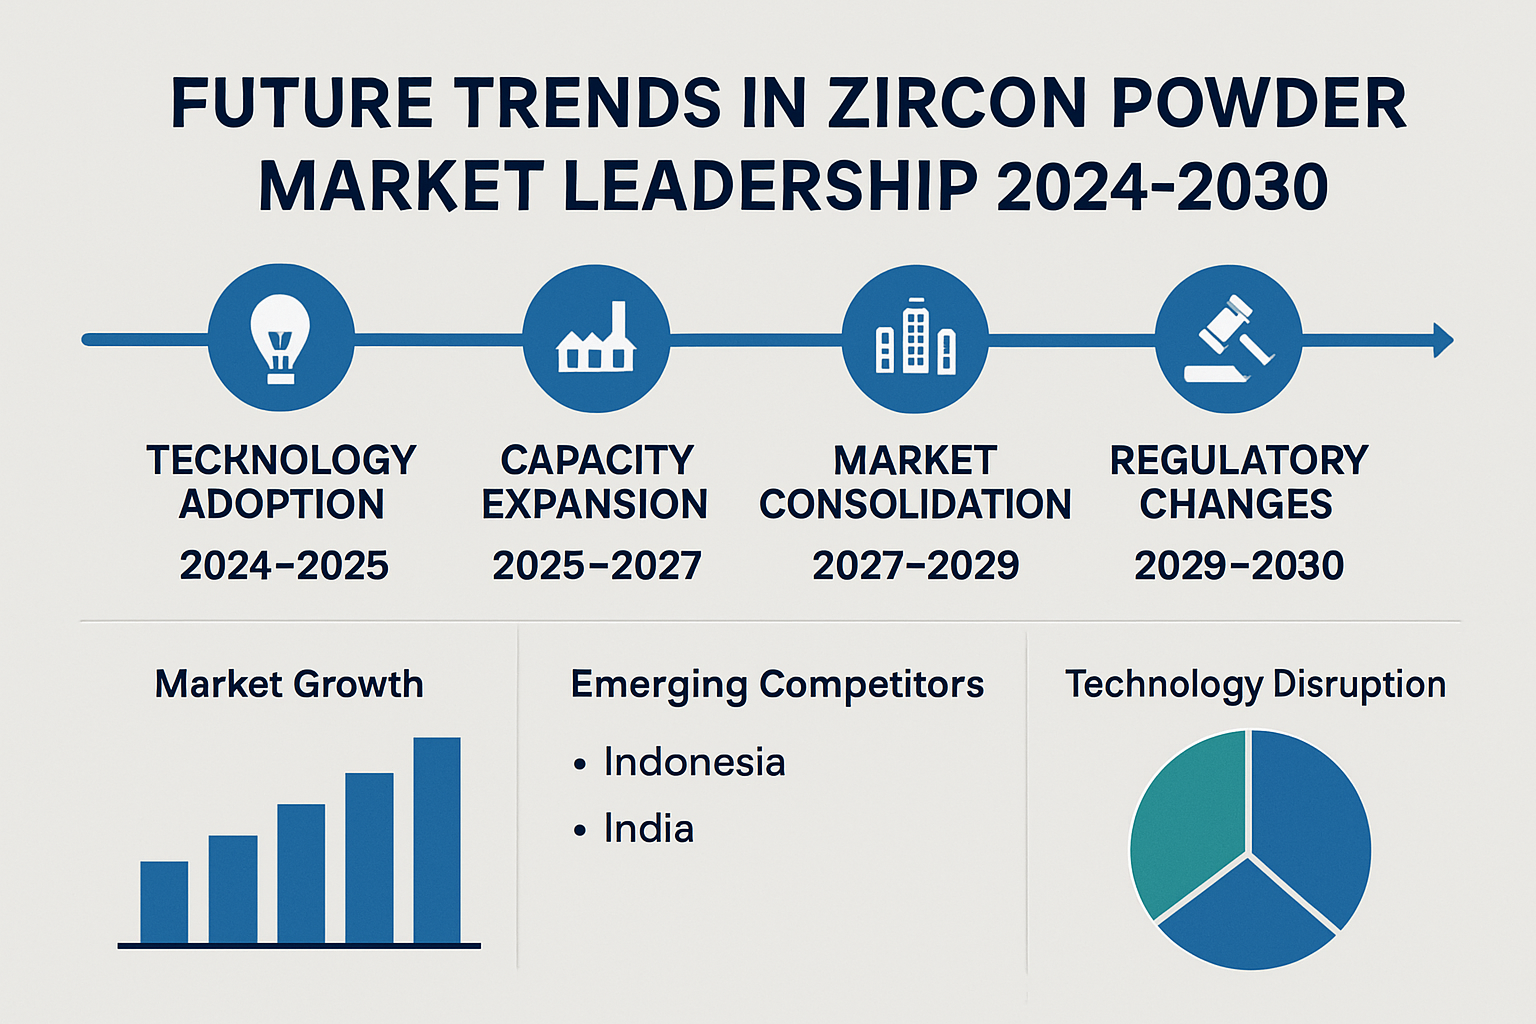
How Will Market Leadership Change?
Market leadership evolution reflects changing industry dynamics, technological developments, and strategic positioning. Here’s what industry experts predict: consolidation trends, emerging competitors, and technology disruptions will reshape competitive landscapes over the next five years.
Emerging competitors challenge established market positions through innovative approaches and strategic investments. Indonesian producers expand capacity through government support and foreign investment partnerships. What makes these competitors dangerous? Lower operational costs and proximity to growing Asian markets.
Technology disruptions impact production efficiency and product quality. Advanced separation technologies improve recovery rates and reduce environmental impact. Automation systems optimize processing parameters and reduce labor costs. Here’s the game-changer: artificial intelligence applications in quality control and process optimization create competitive advantages.
| Change Factor | Impact Timeline | Affected Companies | Market Effect |
|---|---|---|---|
| Capacity Expansion | 2-3 years | Indonesian producers | Increased competition |
| Technology Adoption | 1-2 years | All major producers | Efficiency improvements |
| Market Consolidation | 3-5 years | Mid-size companies | Reduced competition |
| Regulatory Changes | 1-3 years | Global producers | Compliance costs |
Supply chain challenges create opportunities for strategic repositioning. Geopolitical tensions affect trade relationships and sourcing strategies. Transportation cost increases favor regional suppliers over distant competitors. What does this mean for buyers? Diversified supplier bases become increasingly important for supply security.
Future market share projections indicate gradual shifts rather than dramatic changes. Australian producers maintain leadership through quality and technology advantages. Chinese domestic production grows but faces environmental constraints.
Conclusion
Global zircon powder market leadership concentrates among five key producers who control 68% of production capacity through strategic advantages in technology, quality, and market positioning. Iluka Resources leads with 18% zircon powder market share, followed by Tronox at 16%, Richards Bay Minerals at 14%, Exxaro at 10%, and China Zircon Group at 8%. Your zircon powder supplier selection directly impacts production costs, quality consistency, and supply chain reliability.
Global Industry’s procurement experts help B2B buyers evaluate these zircon powder market leaders against specific application requirements, negotiate optimal contract terms, and develop risk-mitigation strategies for critical supply chains. Contact our industrial minerals team today for customized zircon powder supplier analysis and procurement support that reduces costs while ensuring consistent material quality and delivery performance.
FAQ Section
Q1: How accurate are market share estimates for zircon powder producers?
Market share data comes from industry reports, company financial statements, and trade association statistics. While estimates may vary between sources, leading market research firms typically provide accuracy within 5-10% margins. Companies often don’t disclose exact production volumes, so estimates are based on revenue data, facility capacity, and industry expert analysis.
Q2: What factors determine a producer’s market position?
Market position depends on production capacity, product quality consistency, geographic reach, customer relationships, pricing competitiveness, and technical support capabilities. Companies with integrated supply chains, advanced processing technology, and strong distribution networks typically maintain stronger market positions.
Q3: How often do market share rankings change among top producers?
Major shifts in market share rankings typically occur every 3-5 years due to capacity expansions, mergers and acquisitions, or significant market disruptions. However, minor fluctuations in market share percentages happen annually based on demand cycles, production issues, or competitive pricing strategies.
Q4: Which regions offer the best opportunities for new suppliers?
Asia-Pacific markets, particularly China and India, offer significant growth opportunities due to expanding foundry and ceramics industries. Southeast Asian countries also present emerging opportunities as manufacturing sectors develop. However, established suppliers dominate these markets, making entry challenging for new players.
Q5: How do I evaluate suppliers beyond market share data?
Evaluate suppliers based on product quality certifications, technical support capabilities, delivery reliability, pricing stability, and financial strength. Request product samples, visit facilities when possible, check customer references, and assess their ability to meet your specific volume and quality requirements consistently over time.